

Student Learning Objectives
Lessons / Lecture Notes
Important Equations
Example Problems
Applets and Animations
Student Learning Objectives
Lessons / Lecture Notes
The Physics Classroom (conceptual)
PY106 Notes from Boston University (algebra-based):
Physics 2C notes from Dr. Bobby W.S. Lau (algebra-based)
HyperPhysics (calculus-based)
Physics 4B notes from Dr. Bobby W.S. Lau (calculus-based)
Important Equations (for algebra-based Physics)
|
|
|
Example Problems
Example Problems for algebra-based physics (from College Physics 2nd Edition by Knight, Jones, and Field):
Example Problems (Magnetic Induction and Lenz's Law)
Solutions to Example Problems (Magnetic Induction and Lenz's Law)
Example Problems for calculus-based physics (from Fundamentals of Physics 9th Edition by Halliday, Resnick, and Walker):
Example Problems (Electromagnetic Waves)
Solutions to Example Problems (Electromagnetic Waves)
| Electromagnetic Wave | 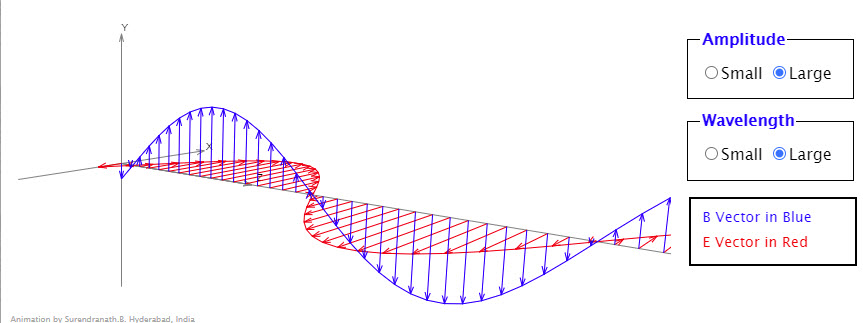 |
Animation shows an electromagnetic wave traveling in the positive z direction. Electric field vectors (x axis) are shown in red color and the magnetic field vectors (y axis) are in blue color.Direction of propagation of the wave is the direction of E×B which is z direction in this case. |
| 3D Electromagnetic Wave |
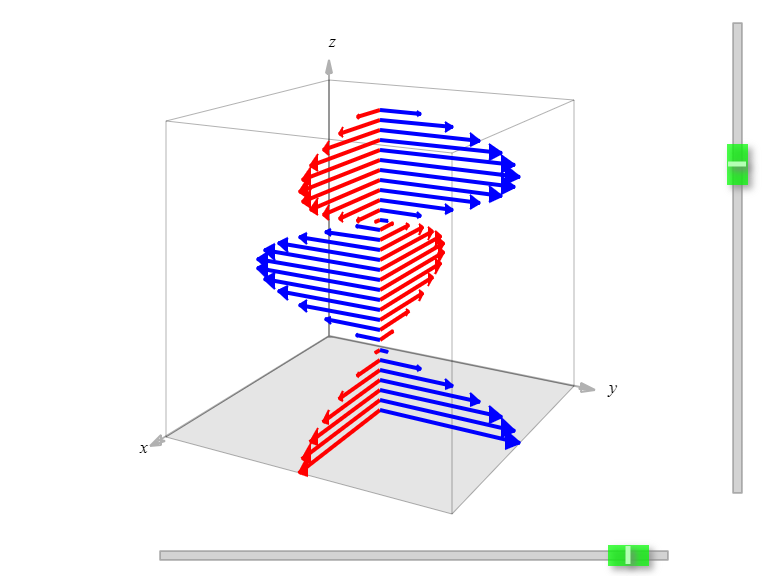 |
This simulation shows a plane-polarized electromagnetic wave that is traveling in the +z direction. One color is for the electric field vectors and the other color is for the magnetic field vectors. The right-hand rule says that if you point the fingers of your right hand in the direction of the electric field vector at a particular location, and then curl your fingers into the direction of the magnetic field vectors, your thumb should point in the direction of the way the wave is traveling. Using this rule, you should be able to determine which color arrows represent the electric field vectors and which color arrows represent the magnetic field vectors. |
| Electromagnetic Wave | 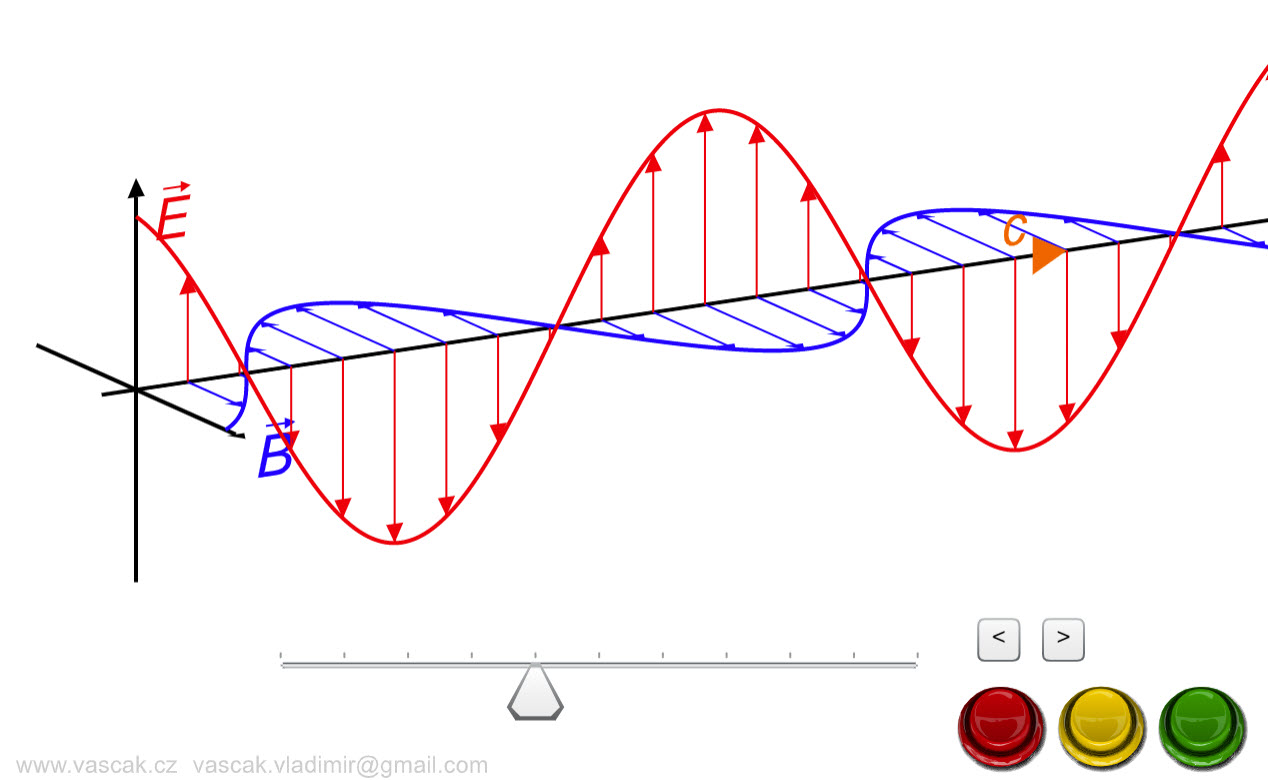 |
Nice animation showing an electromagnetic wave. |
| Electromagnetic Wave |
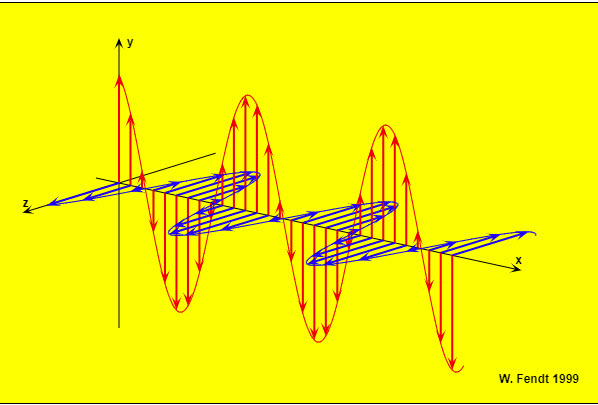 |
This animation shows an electromagnetic wave, namely a plane polarized wave, which propagates in positive x direction. The vectors of the electric field (red) are parallel to the y axis, the vectors of the magnetic field (blue) are parallel to the z axis. |
| The Visible Spectrum | 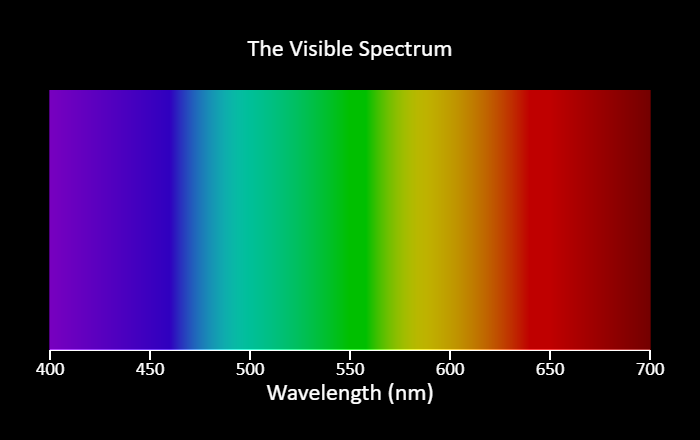 |
This is not an interactive simulation, but a representation of the visible spectrum. Humans are generally sensitive to light with wavelengths between 400 nm (violet) and 700 nm (red). |
| Radio Waves and Electromagnetic Fields |
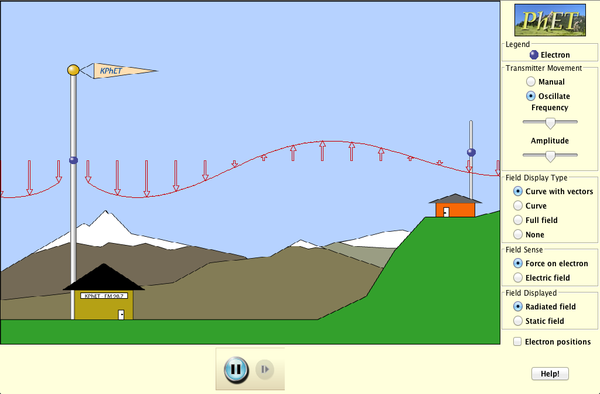 |
Broadcast radio waves from KPhET. Wiggle the transmitter electron manually or have it oscillate automatically. Display the field as a curve or vectors. The strip chart shows the electron positions at the transmitter and at the receiver. |
| Radiating Charge | 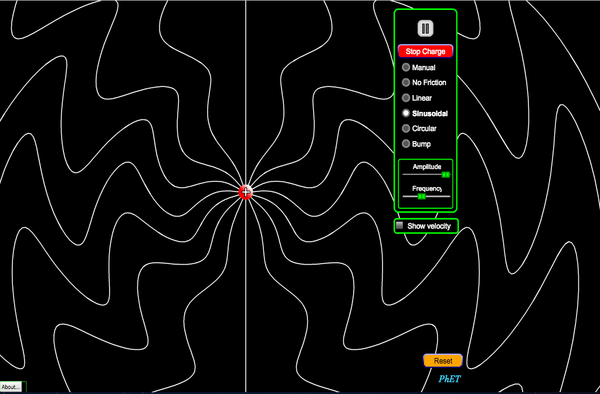 |
The electric field lines from a point charge evolve in time as the charge moves. Watch radiation propagate outward at the speed of light as you wiggle the charge. Stop a moving charge to see bremsstrahlung (braking) radiation. Explore the radiation patterns as the charge moves with sinusoidal, circular, or linear motion. You can move the charge any way you like, as long as you don’t exceed the speed of light. |
| EM Doppler Effect | 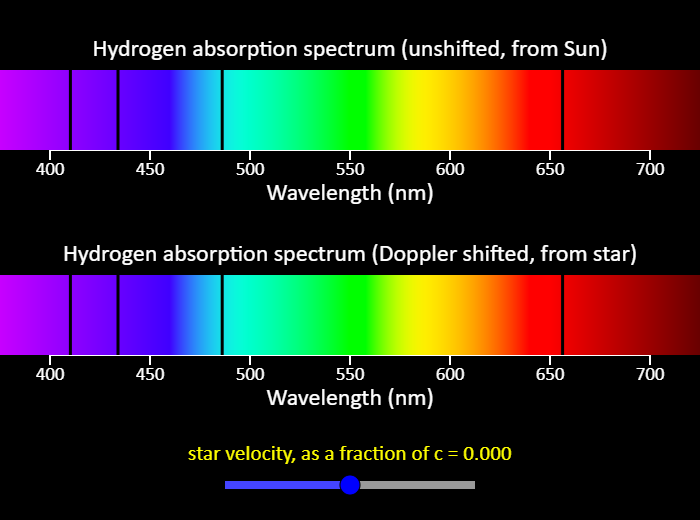 |
In this simulation, you can explore the concept of the Doppler shift for electromagnetic waves. At the top is a simplified version of the emission spectrum from the Sun. You might expect the Sun to emit light of all wavelengths, but we actually see an absorption spectrum, seeing dark bands at wavelengths corresponding to emission lines from a hydrogen gas tube. This is because hydrogen atoms in the Sun actually absorb photons at those wavelengths, exciting their electrons to higher states. Other stars do similar things. The spectrum at the bottom shows the spectrum from a distant star. Using the slider, you can set the velocity of the star with respect to us, measured as a fraction of the speed of light. Positive means the star is moving away from us, and negative means it is moving toward us. For instance, +0.100 means the star is moving away from us at 1/10th of the speed of light. Because the universe is expanding, most stars in the universe are moving away from us. This causes the wavelengths of light emitted by the star to increase - this is known as redshift. As you can see in the simulation, for stars moving away from us the hydrogen absorption lines are shifted toward the red end of the spectrum, hence the name redshift. If a star is traveling toward us, the lines are blueshifted, as you can see for negative velocities in the simulation. |
| Color Vision |
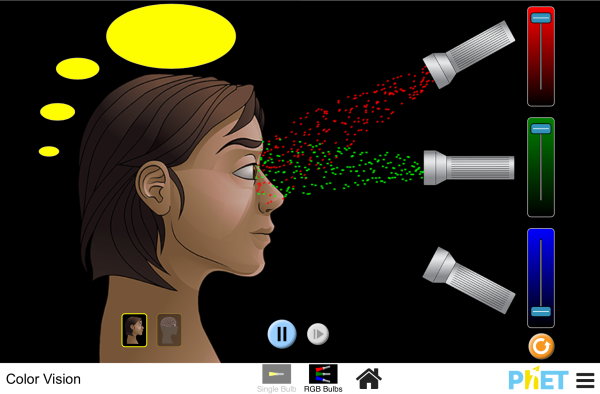 |
Make a whole rainbow by mixing red, green, and blue light. Change the wavelength of a monochromatic beam or filter white light. View the light as a solid beam, or see the individual photons. |
| Color Addition and Subtraction | 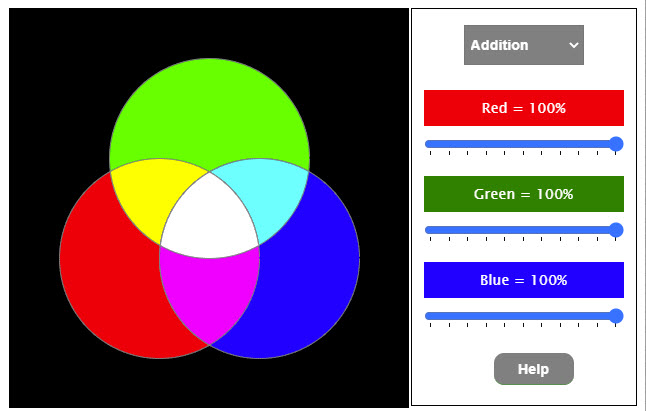 |
This excellent animation illustrates color addition and subtraction. |
| Color Addition and Subtraction |
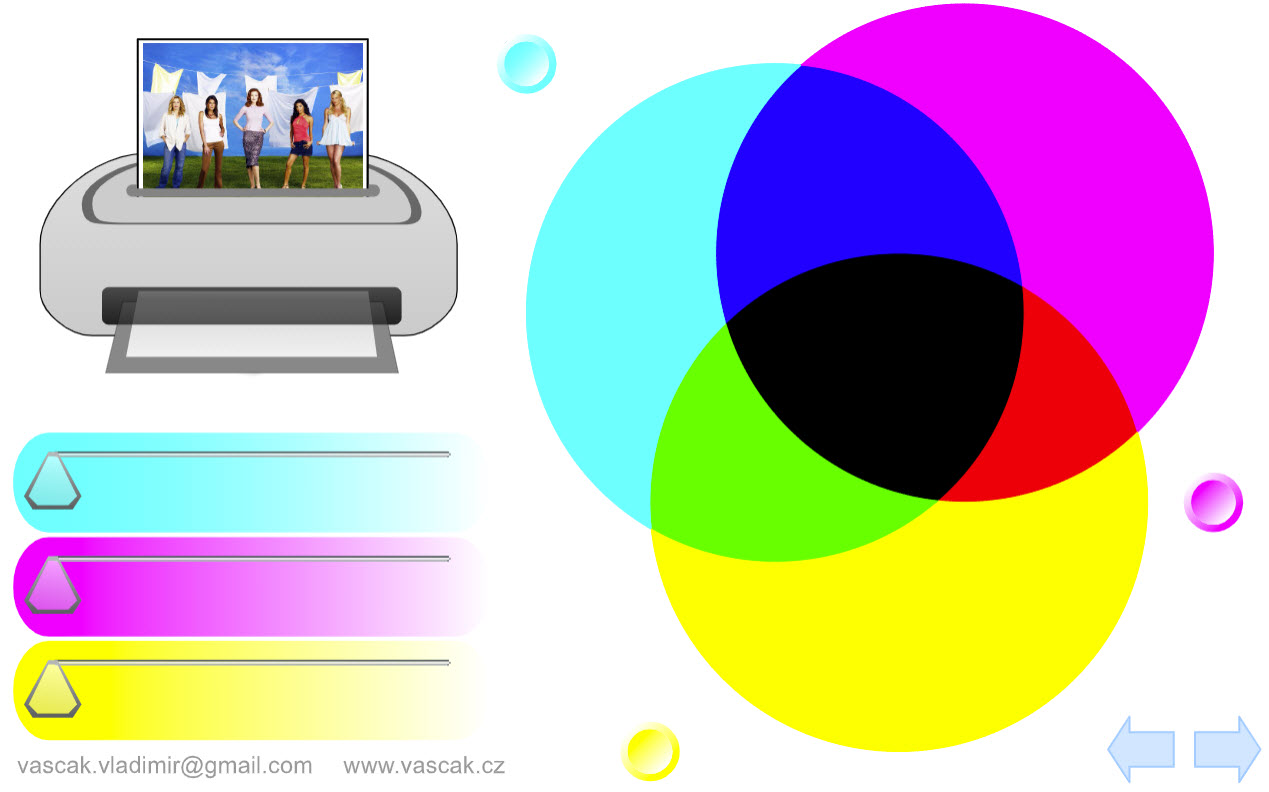 |
Nice animation showing color addition and color subtraction. |
| Lunar Phases | 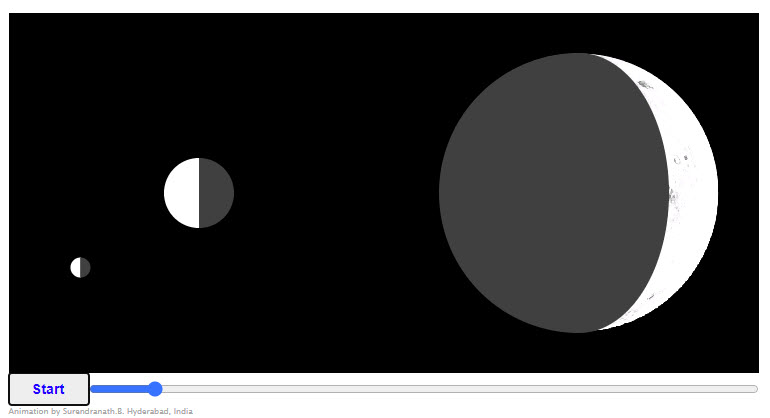 |
Moon's disc shown at the right is the moon as viewed by an observer located on the earth below the moon. Sun is imagined to be to the left. You will notice that both darkening and brightening begin from the right edge. See if that makes sense. Diagrams are not to scale. |
| Eye Defects | 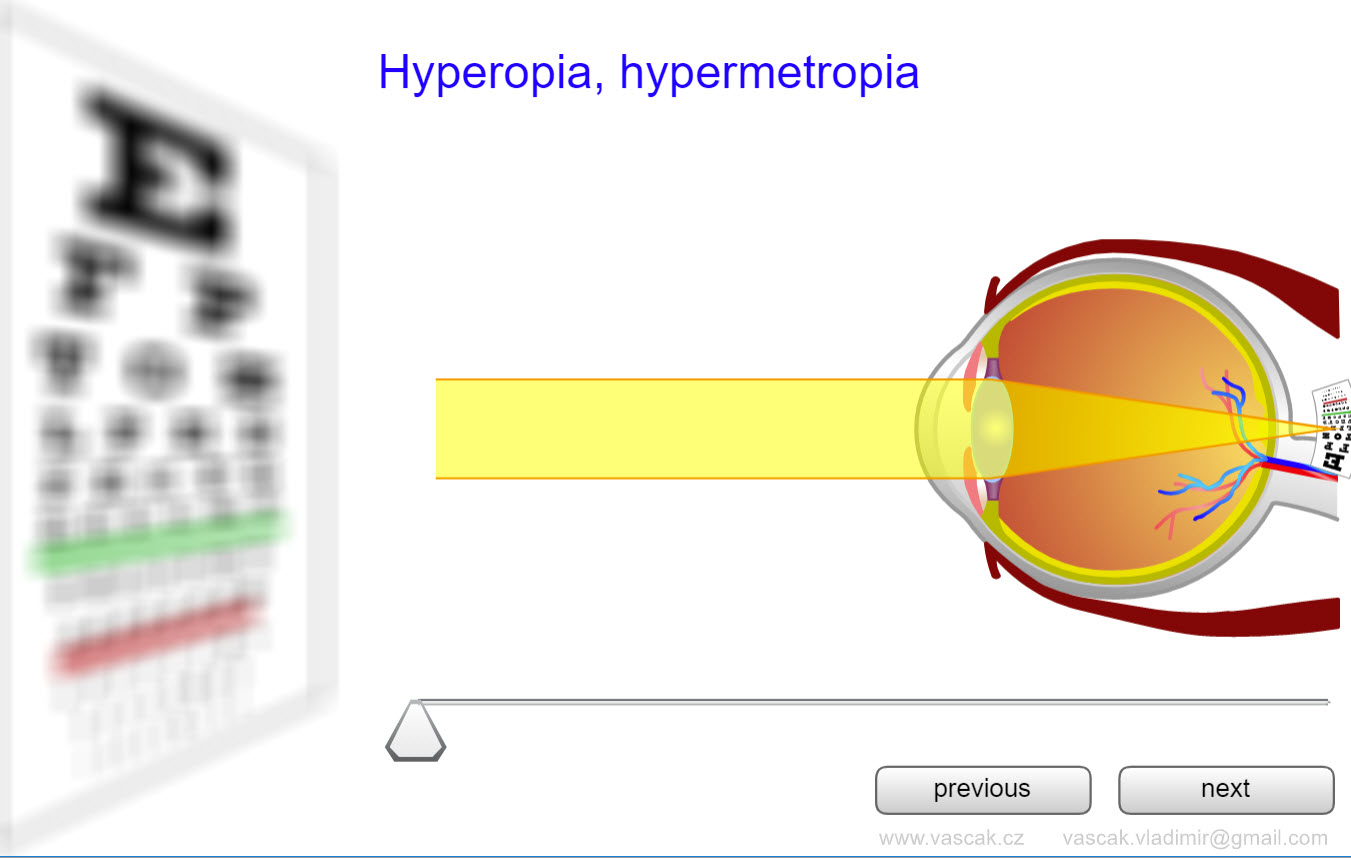 |
Very cool animation showing the different types of eye defects and how they are corrected. |
| Accomodation | 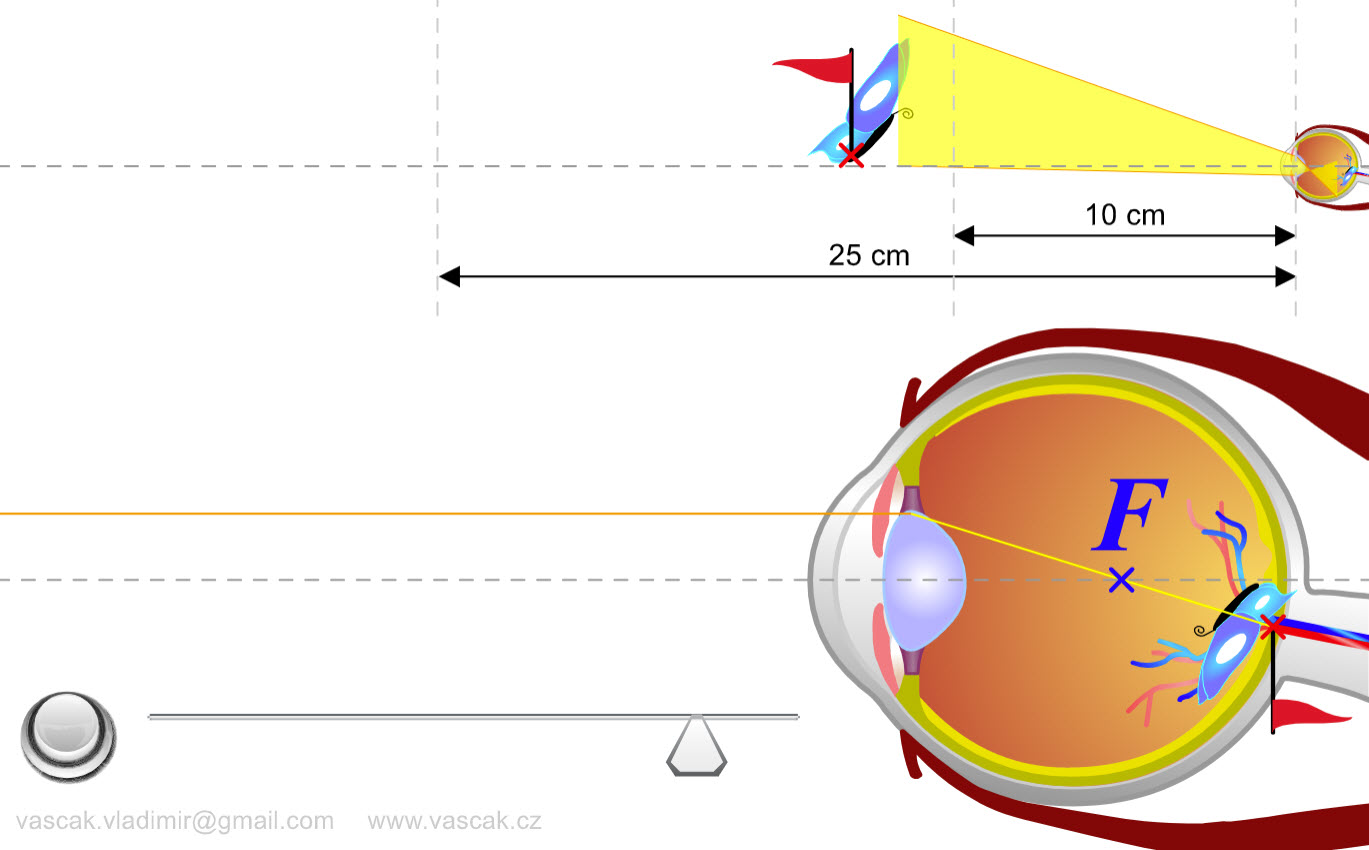 |
Nice animation showing how the eye accomodates to focus on things at different distances. |
| Solar Sailboat |
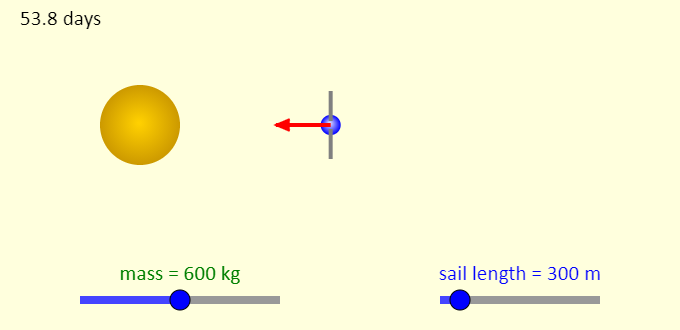 |
This is a simulation of a solar sail - a satellite or space probe that uses the radiation pressure of sunlight, reflecting from its sails, as its form of propulsion. The solar sail starts from rest at the same distance from the Sun that the Earth is. Use the sliders to adjust the mass of the solar sail and the length of each side of the sail, which we assume to be square. The large yellow object is the Sun. The smaller blue object is the solar sail. The arrow attached to the solar sail represents the acceleration of the sail. The acceleration comes from the vector sum of the gravitational force the Sun exerts on the solar sail (that force is pointed toward the Sun), and the force associated with radiation pressure (that force points away from the Sun). |
| Polarizing Filter |  |
A very nice animation showing how a polarizing filter works. |
| One Polarizer | 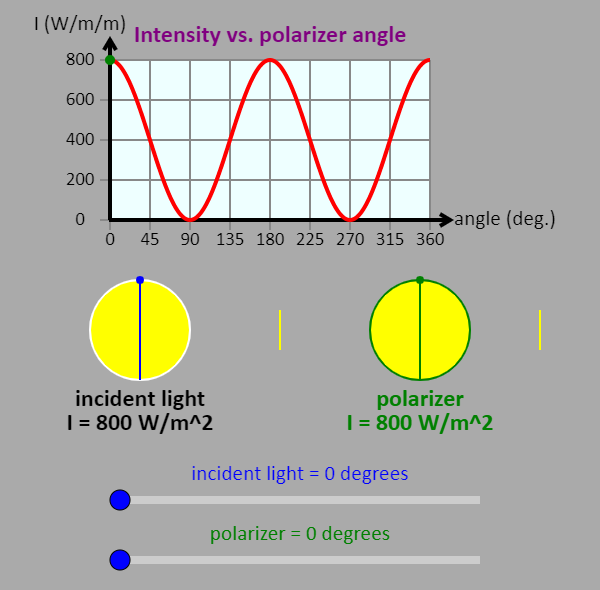 |
This is a simulation of what happens when polarized light with an intensity of 800 W/m2 is incident on a polarizer. The light is traveling from left to right. Use the sliders to adjust the polarization direction of the light and the angle of the transmission axis of the polarizer. The graph shows the intensity of the light as a function of the angle of the transmission axis of the polarizer. The line between the incident light disk and the polarizer shows the direction the incident light is polarized in. The line to the right of the polarizer shows the direction the light is polarized in after passing through the polarizer. |
| Polarized Light | 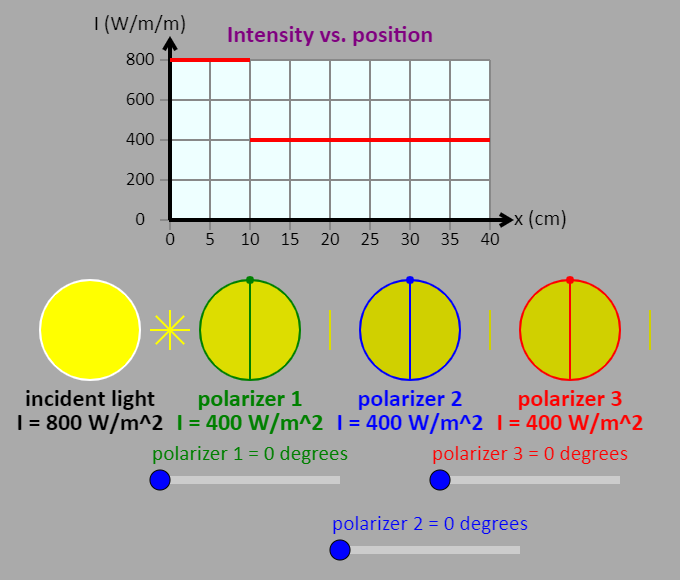 |
This is a simulation of what happens when unpolarized light, with an intensity of 800 W/m2 is incident on a sequence of three polarizers. The light is traveling in the +x direction and the polarizers are located at x = 10 cm, x = 20 cm, and x = 30 cm. Use the sliders to adjust the angle of the transmission axis of each polarizer. The graph shows the intensity of the light at different locations along the x axis. The lines after each polarizer show the direction the light is polarized in. The incident light has multiple lines to show that it is unpolarized. |
| Polarized Light | 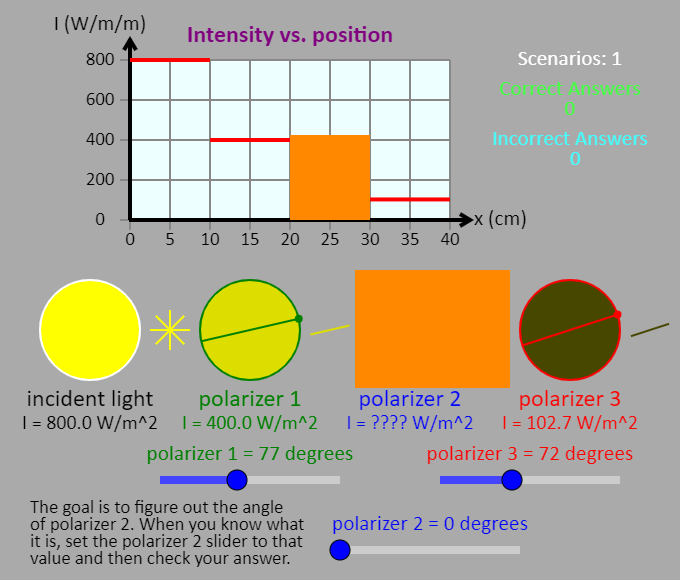 |
Orange curtains are used to cover up part of the graph and polarizer 2. Your goal is to determine the angle of the transmission axis of polarizer 2. Once you have figured it out, set the "polarizer 2" slider to that angle, and check your answer. If you're right, the curtains will be removed. If not, you can try again. Feel free to use the polarizer 1 and polarizer 3 sliders to adjust the angle of the transmission axes of those polarizers. (Note that the polarizer 2 slider does not adjust the angle of polarizer 2.) The graph shows the intensity of the light at different locations along the x axis. See how many different ways you can figure out the answer. |