

Student Learning Objectives
Lessons / Lecture Notes
Important Equations
Example Problems
Applets and Animations
Student Learning Objectives
PY105 Notes from Boston University (algebra-based):
Physics 2B notes from Dr. Bobby W.S. Lau (algebra-based)
HyperPhysics (calculus-based)
Physics 4C notes from Dr. Bobby W.S. Lau (calculus-based)
Important Equations (for algebra-based Physics)
|
|
|
Example Problems
Example Problems for algebra-based physics (from College Physics 2nd Edition by Knight, Jones, and Field):
Example Problems (Using Energy and Thermal Properties)
Solutions to Example Problems (Using Energy and Thermal Properties)
Example Problems for calculus-based physics (from Fundamentals of Physics 9th Edition by Halliday, Resnick, and Walker):
Example Problems (Temperature, Heat, and First Law) | Example Problems (Kinetic Theory) | Example Problems (Entropy and Second Law of Thermo)
Solutions to Example Problems (Temperature, Heat, and First Law) | Solutions to Example Problems (Kinetic Theory) | Solutions to Example Problems (Entropy)
| Heat Transfer - Conduction |
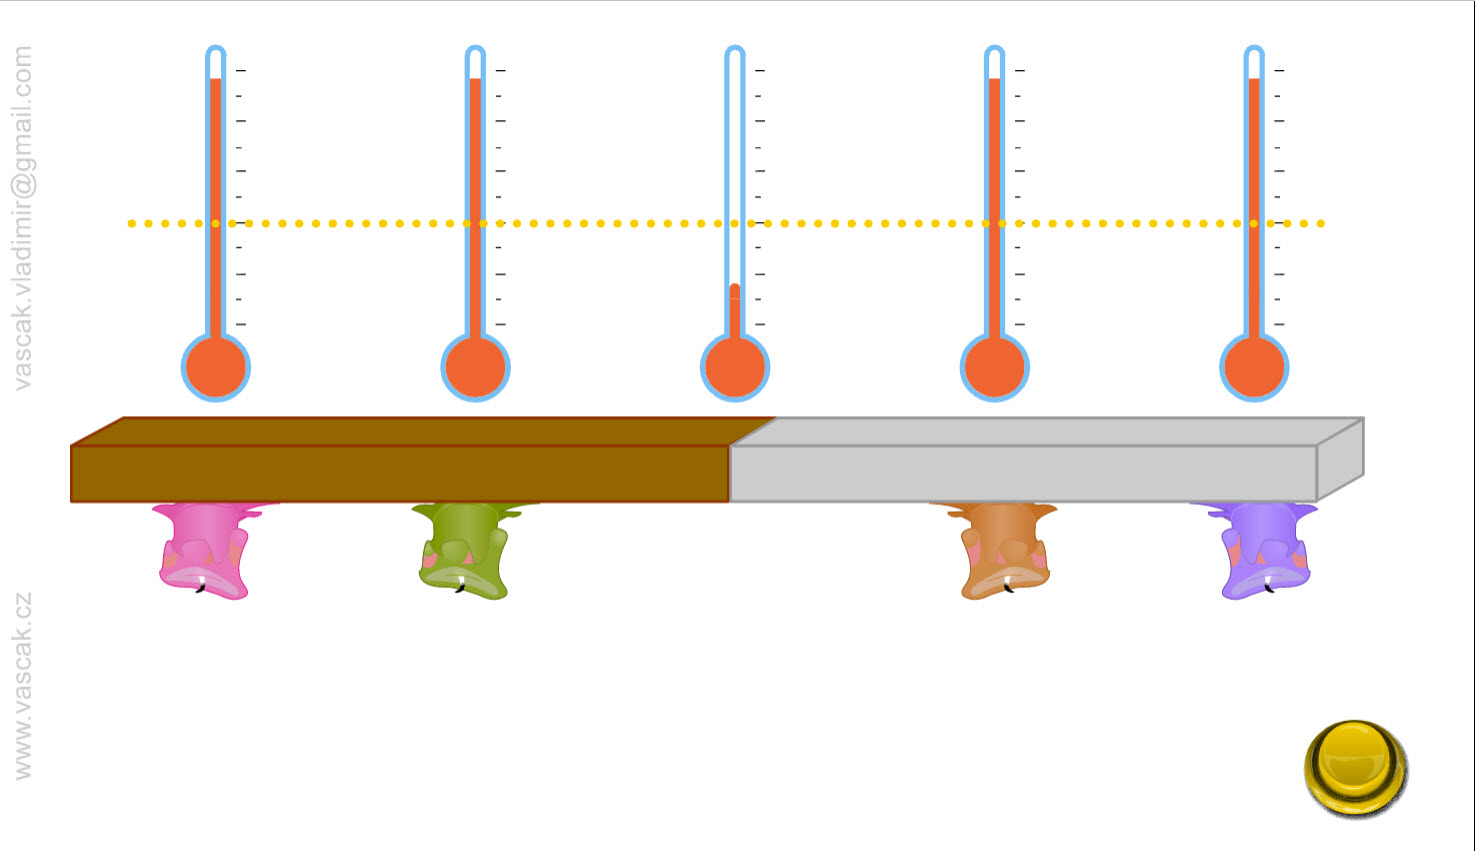 |
Animation showing heat transfer by conduction. |
| Heat Transfer - Convection |
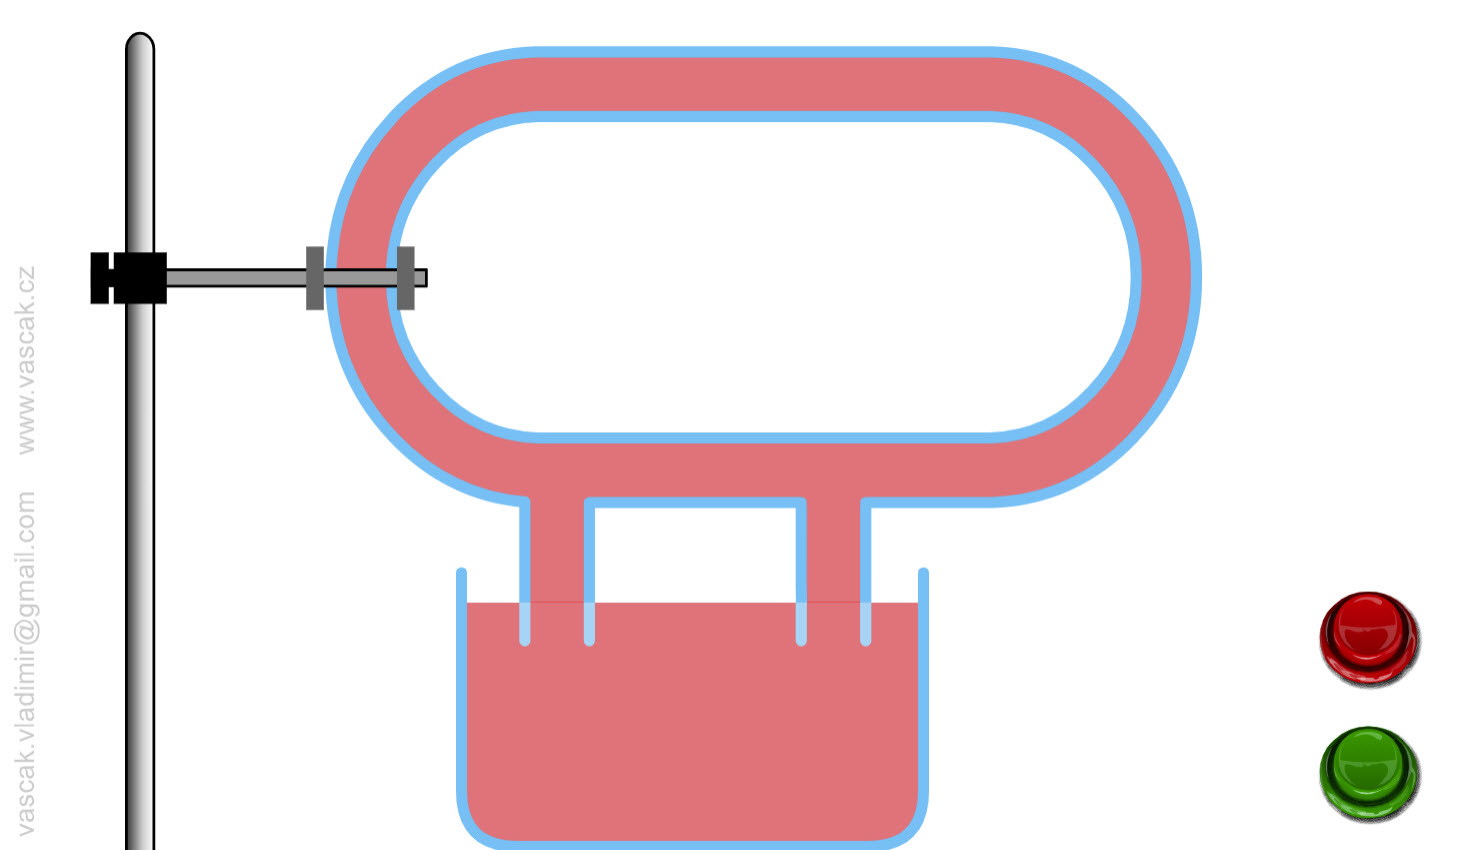 |
Animation showing heat transfer by convection. |
| Heat Transfer - Radiation | 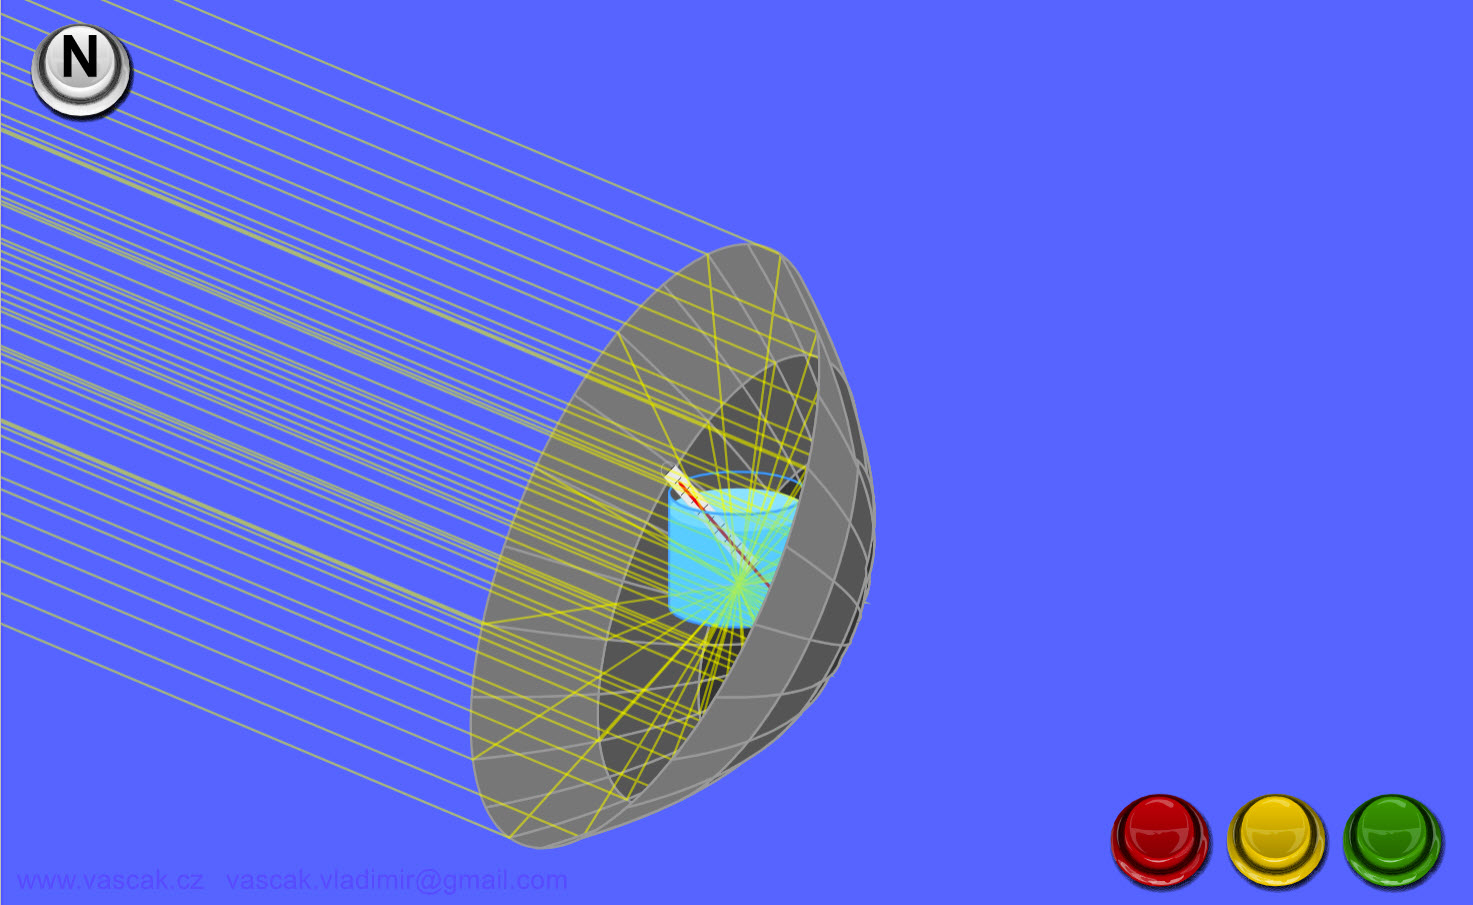 |
Animation showing heat transfer by radiation. |
| Microwaves | 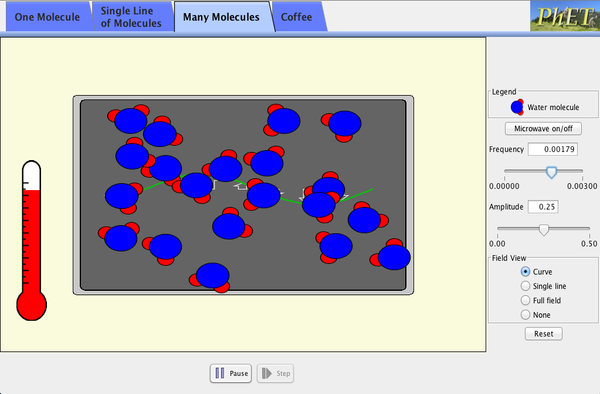 |
How do microwaves heat up your coffee? Adjust the frequency and amplitude of microwaves. Watch water molecules rotating and bouncing around. View the microwave field as a wave, a single line of vectors, or the entire field. |
| Energy Forms and Changes | 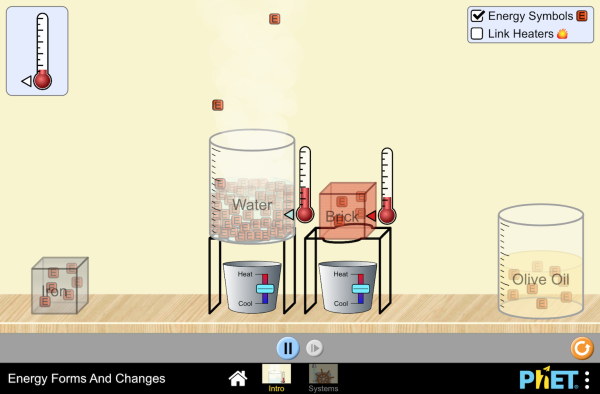 |
Explore how heating and cooling iron, brick, water, and olive oil adds or removes energy. See how energy is transferred between objects. Build your own system, with energy sources, changers, and users. Track and visualize how energy flows and changes through your system. |
| Temperature vs. Time |
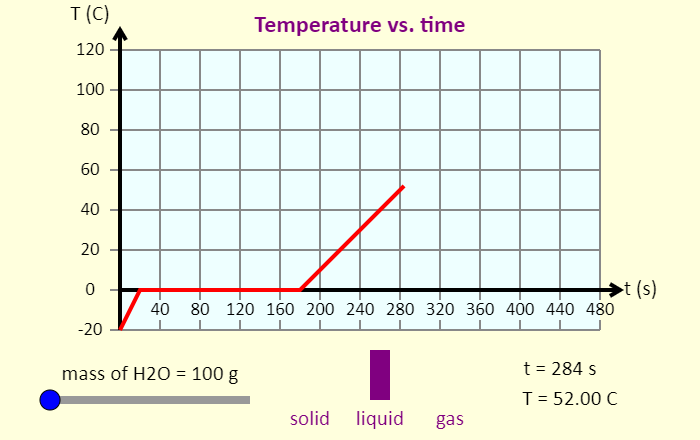 |
This simulation shows the graph of temperature as a function of time for a sample of water that starts at -20 degrees C, and has heat added to it at a constant rate. The simulation uses constants in units of calories, because those are nice numbers for water. The specific heat of liquid water is 1 cal / (g deg. C), while the specific heat of solid or gaseous water is 0.5 cal / (g deg. C). The latent heat of fusion of water is 80 cal / g, and the latent heat of vaporization of water is 540 cal / g. With these numbers and the information from the graph, you should be able to figure out the rate at which energy is added to the water sample. Don't forget to be amazed by how much time the sample spends changing phase. |
| Newton's Law of Cooling | 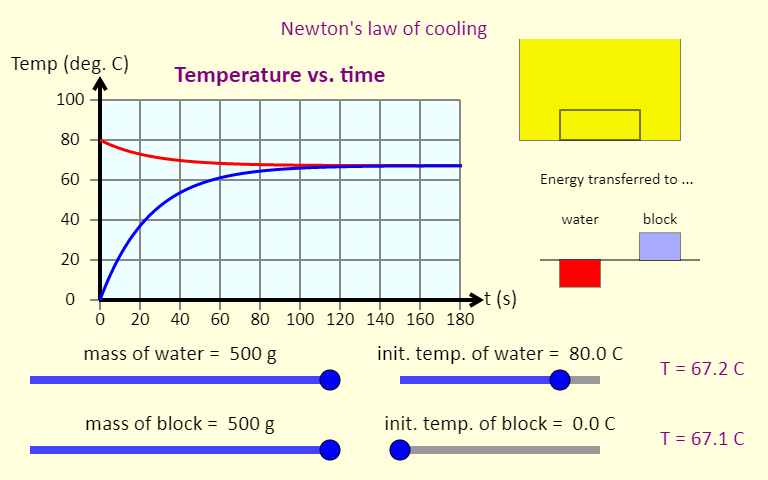 |
This simulation illustrates Newton's law of cooling, which shows what happens to the temperatures of some water and a metal block when they are put together. The simulation graphs the temperature as a function of time. It also shows a representation of the block in the water (top right), color-coded by temperature; bar graphs (middle right) showing the energy transferred to the water and the block (negative means energy was removed); and temperature readouts (bottom right). Use the sliders to set the initial mass of the water and the block, as well as their initial temperatures. You can use the buttons at the bottom to choose from three different metals. You should be able to rank these metals based on their specific heat. |
| Reversible Reactions |  |
Watch a reaction proceed over time. How does total energy affect a reaction rate? Vary temperature, barrier height, and potential energies. Record concentrations and time in order to extract rate coefficients. Do temperature dependent studies to extract Arrhenius parameters. This simulation is best used with teacher guidance because it presents an analogy of chemical reactions. |
| PV Diagrams | 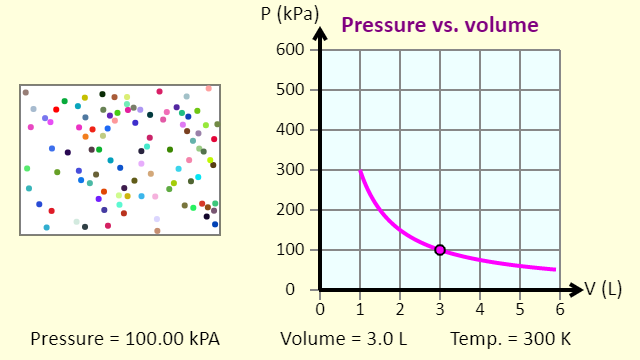 |
This simulation introduces the P-V (pressure-volume) diagram. See what happens when the temperature of the ideal gas or the volume is changed (at constant temperature). You can also sketch a pressure vs. volume graph for a given temperature, by choosing a temperature and then using the volume slider to cover the full range of volumes. The line that is plotted in that case is called an isotherm, a line of constant temperature. |
| A Thermodynamic Cycle | 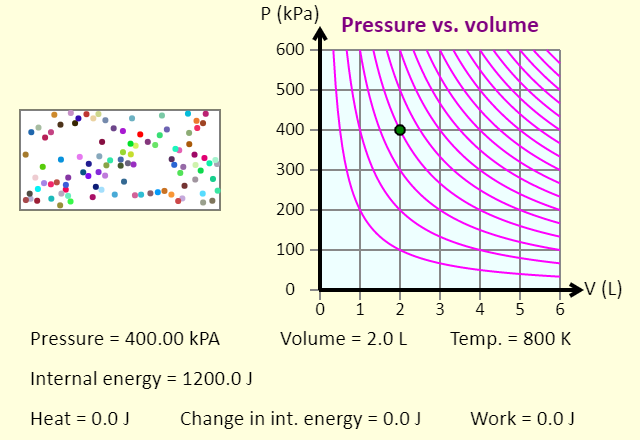 |
This animation shows one specific thermodynamic cycle for a monatomic ideal gas. This particular cycle consists of (1) adding heat at constant pressure, to double the temperature; (2) removing heat at constant volume, returning to the original temperature; followed by (3) an isothermal compression that returns the system to the initial state. Once you press the "Start the cycle" button, the animation runs through the three steps, in turn, and then shows the entire cycle. For the entire cycle, the red shaded area, enclosed by the cycle, represents the net work done by the gas in the cycle. |
| Some Special Thermodynamic Processes | In this simulation, you can investigate constant pressure (isobaric), constant volume (isochoric), and constant temperature (isothermal) processes. You can add or remove 400 J of heat with any of these processes, and see what happens to the gas itself, the resulting path on the P-V diagram, and also the impact on the various parameters. Note that the purple isotherms on the P-V diagram are separated by 200 K, and the gas is monatomic. The gas does no work in a constant volume process. The work done in a constant pressure process or in a constant temperature process is indicated by the shaded area below the path on the P-V diagram. This is shaded red if the work done by the gas is positive, and blue if the work done by the gas is negative. Note that the unit the kPa liter is a joule, so the area under the curve has units of joules.
|
|
| Special Processes of an Ideal Gas | 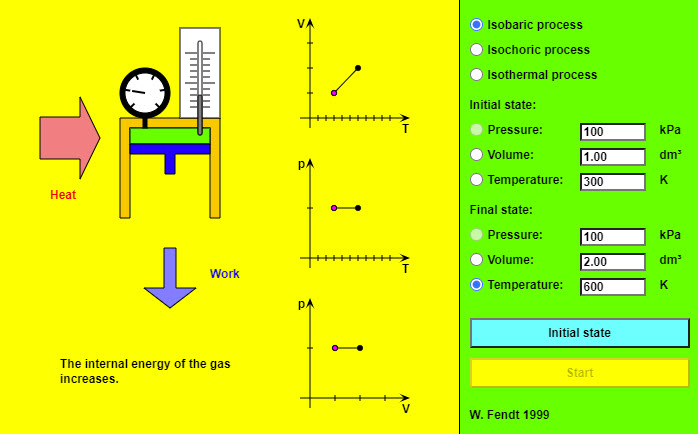 |
This nice animation shows the different special processes of an ideal gas. |
| Isothermal Process | 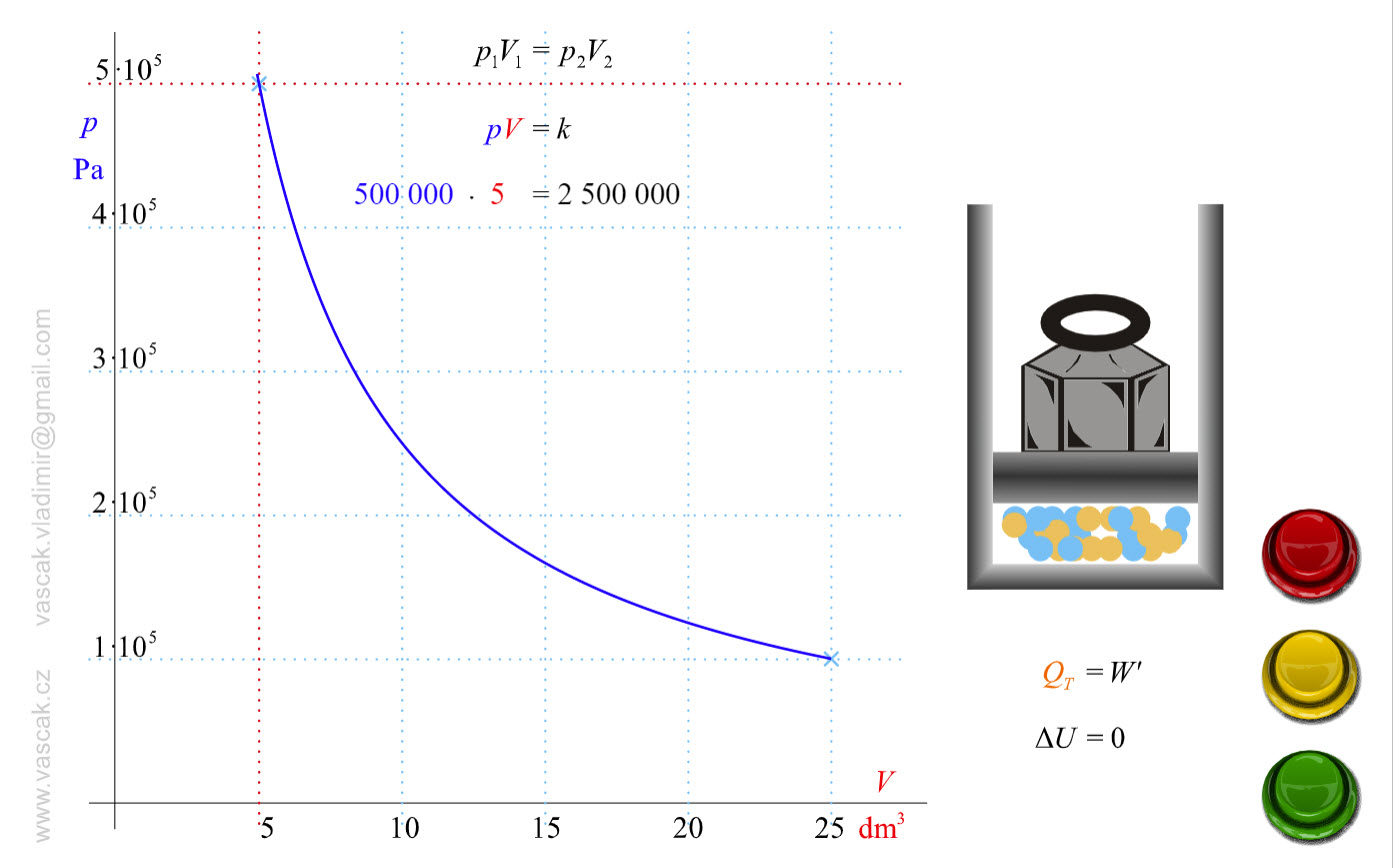 |
Animation showing an isothermal process of an ideal gas. |
| Isobaric Process | 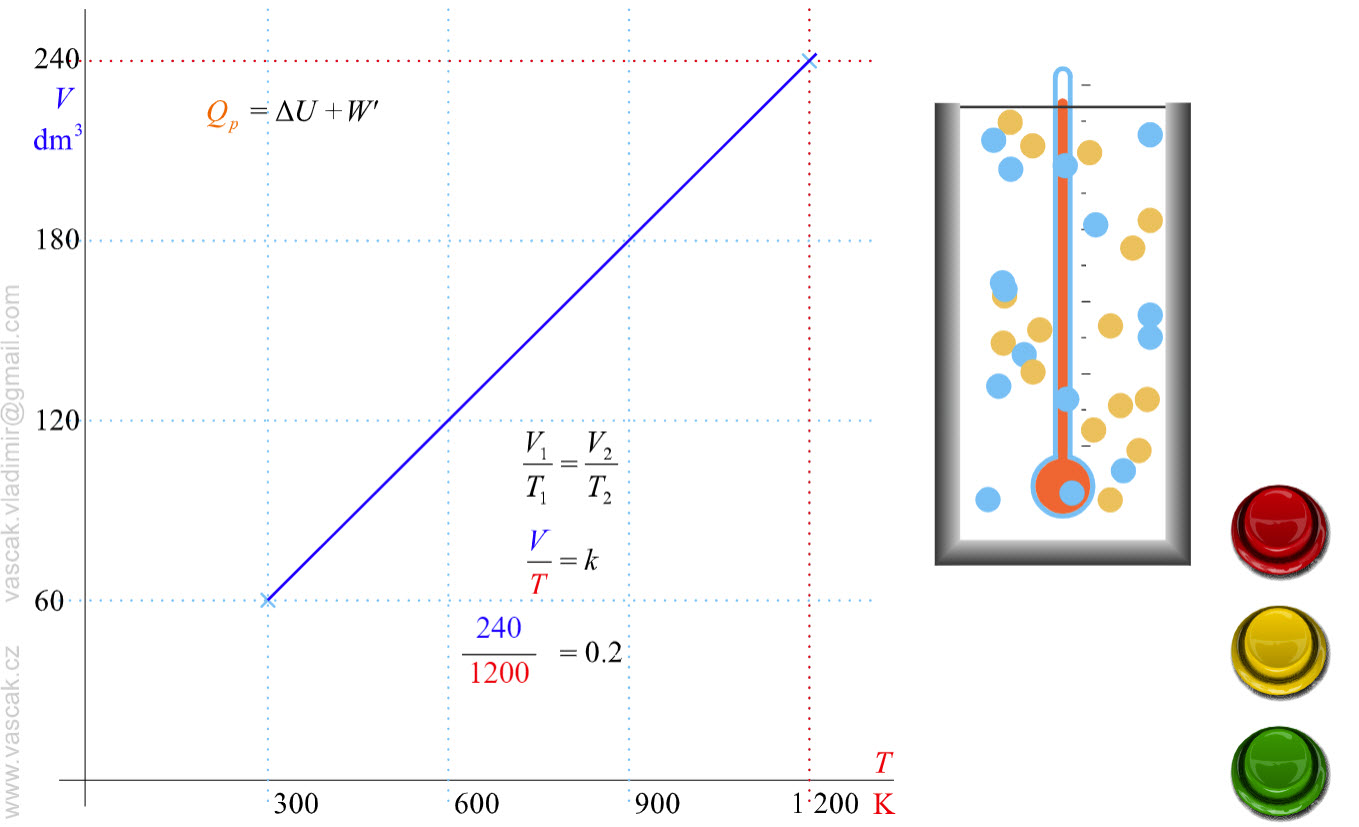 |
Animation showing an isobaric process of an ideal gas. |
| Isochoric Process | 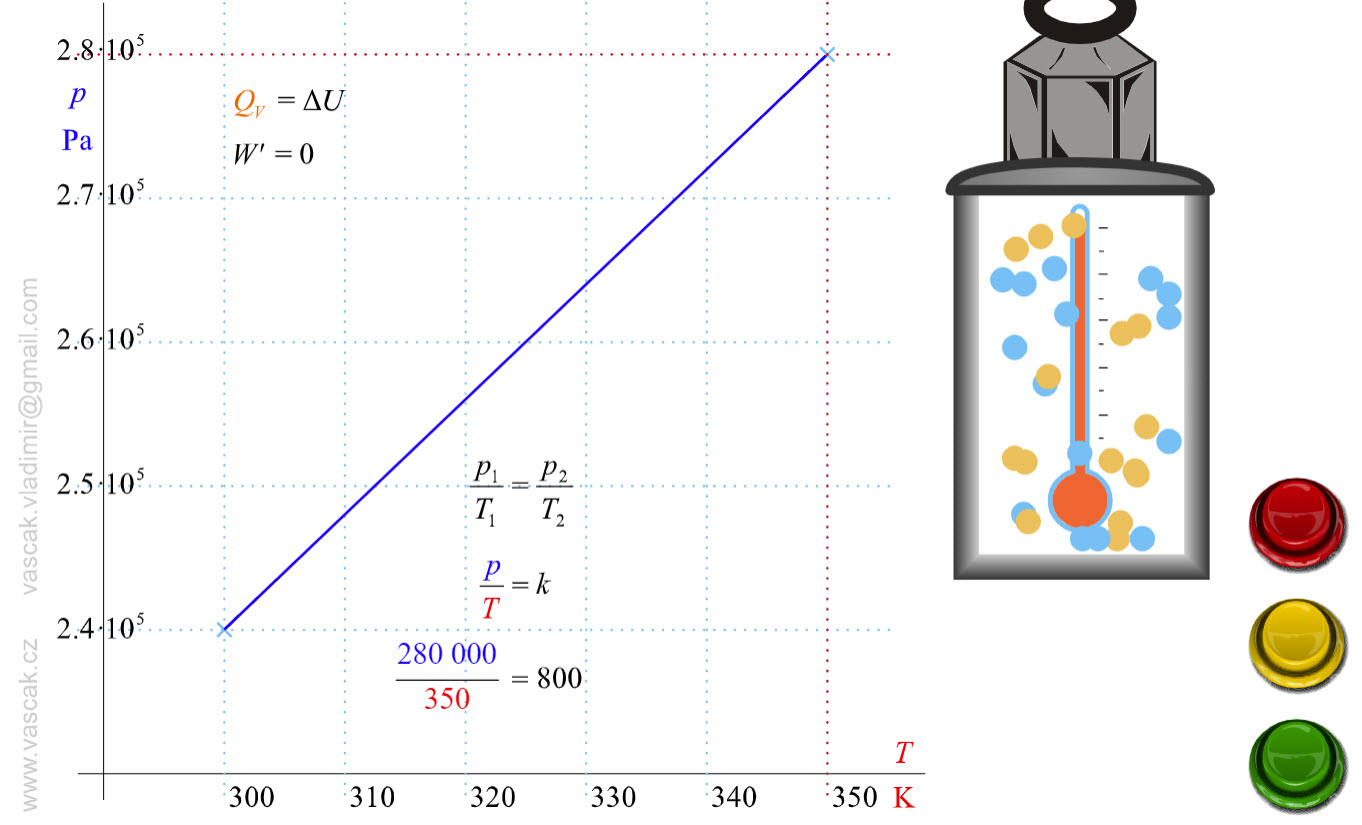 |
.Animation showing an isochoric process of an ideal gas. |
| Adiabatic Process | 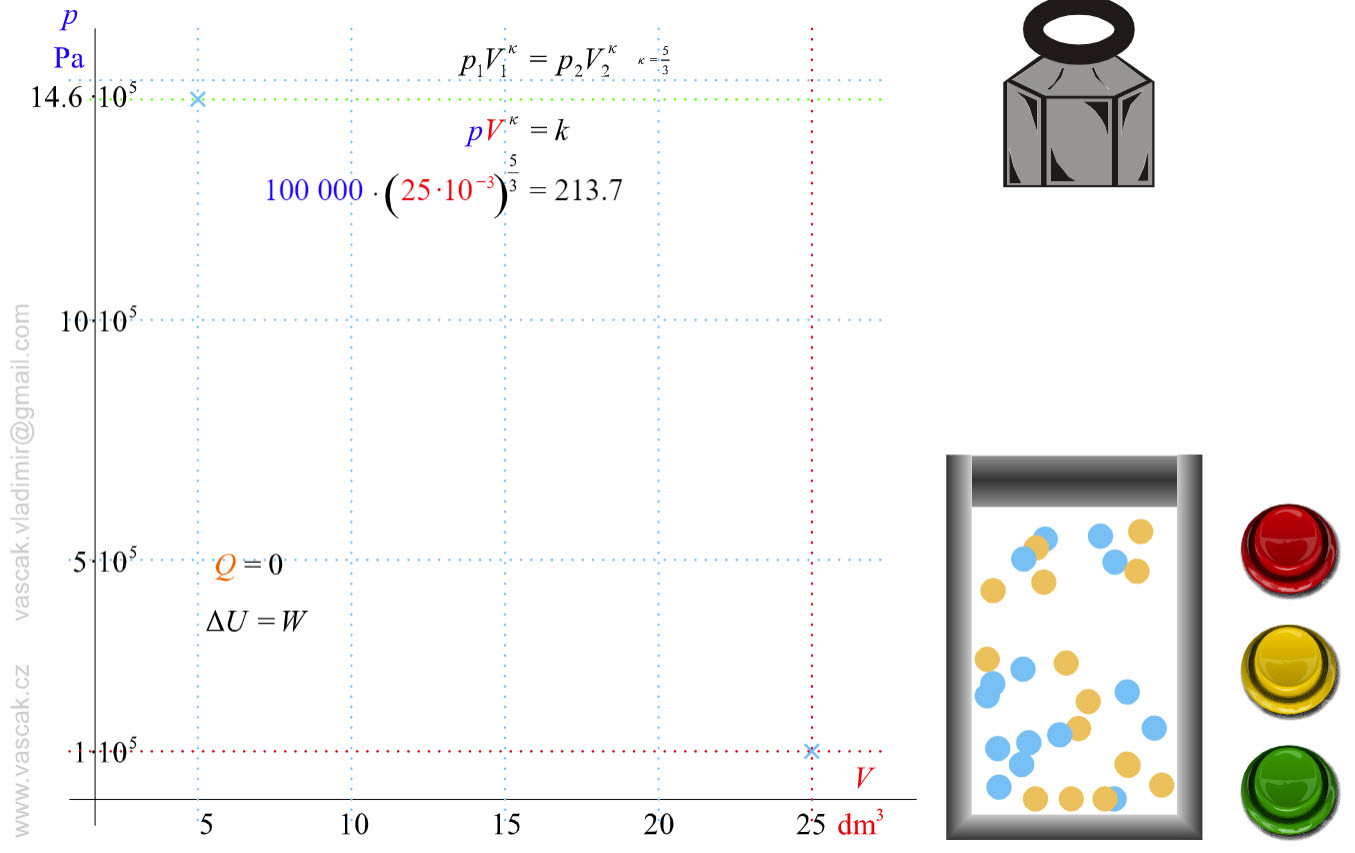 |
Animation showing an adiabatic process of an ideal gas. |
| Comparing Isothermal and Adiabatic Processes | 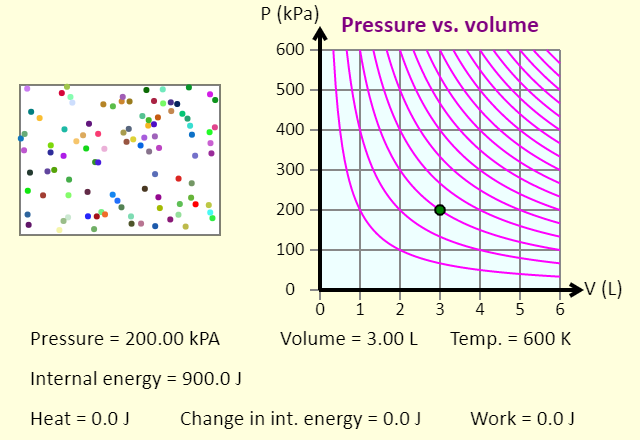 |
In this simulation, you can look at the difference between a constant temperature (isothermal) process and an adiabatic process. The paths look somewhat similar on the P-V diagram, but you should notice clear differences. Note that an isothermal process has no change in temperature, so the change in internal energy is zero, but in an adiabatic process the heat transferred is zero. Note that for each press of a button, the volume will change by 1 liter, unless that carries the system off the graph. What are some things that you notice about an isothermal process vs. an adiabatic process? |
| Adiabatic Mechanism | 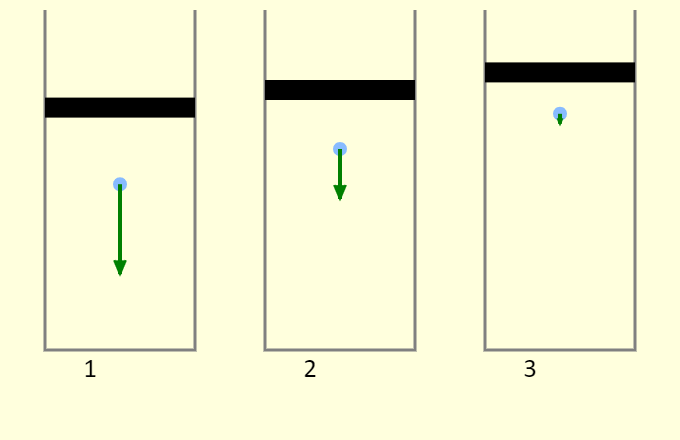 |
Why does compressing a gas often increase the temperature, while allowing the volume to expand often leads to cooling? This simulation demonstrates the process, looking at a single atom in a cylinder. First, remember that temperature is directly tied to kinetic energy - if the atoms moves faster, on average, then the temperature has increased, and if the atoms move slower, the temperature has decreased. Consider cylinder 2, which has a fixed volume. The atom collides elastically with the bottom of the piston. This reverses the direction of the atom's velocity but does not change the atom's kinetic energy, so the temperature does not change. In cylinder 1, the atom collides elastically with the bottom of the piston, but the piston is moving down. This both reverses the direction of the atom's velocity and increases the speed of atom, so the temperature increases. We're modeling the collision as an elastic collision between a large-mass object (the piston) and a small-mass object (the atom). The collision essentially has no impact on the piston, and the relative speed between the piston and the atom remains the same before and after (because the collision is elastic). This has the effect of increasing the speed of the atom by twice the speed of the piston. In cylinder 3, the atom collides elastically with the bottom of the piston, but the piston is moving up. This both reverses the direction of the atom's velocity and decreases the speed of atom, so the temperature decreases. Again, this collision essentially has no impact on the piston, and the relative speed between the piston and the atom remains the same before and after. This has the effect of decreasing the speed of the atom by twice the speed of the piston.
|
| Carnot Cycle | 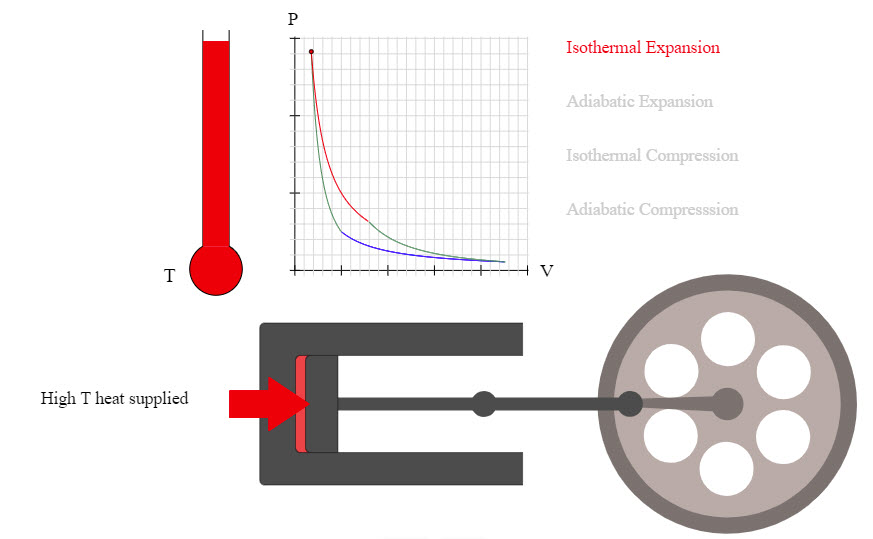 |
Nice animation showing the Carnot Cycle. |
| Carnot Cycle | 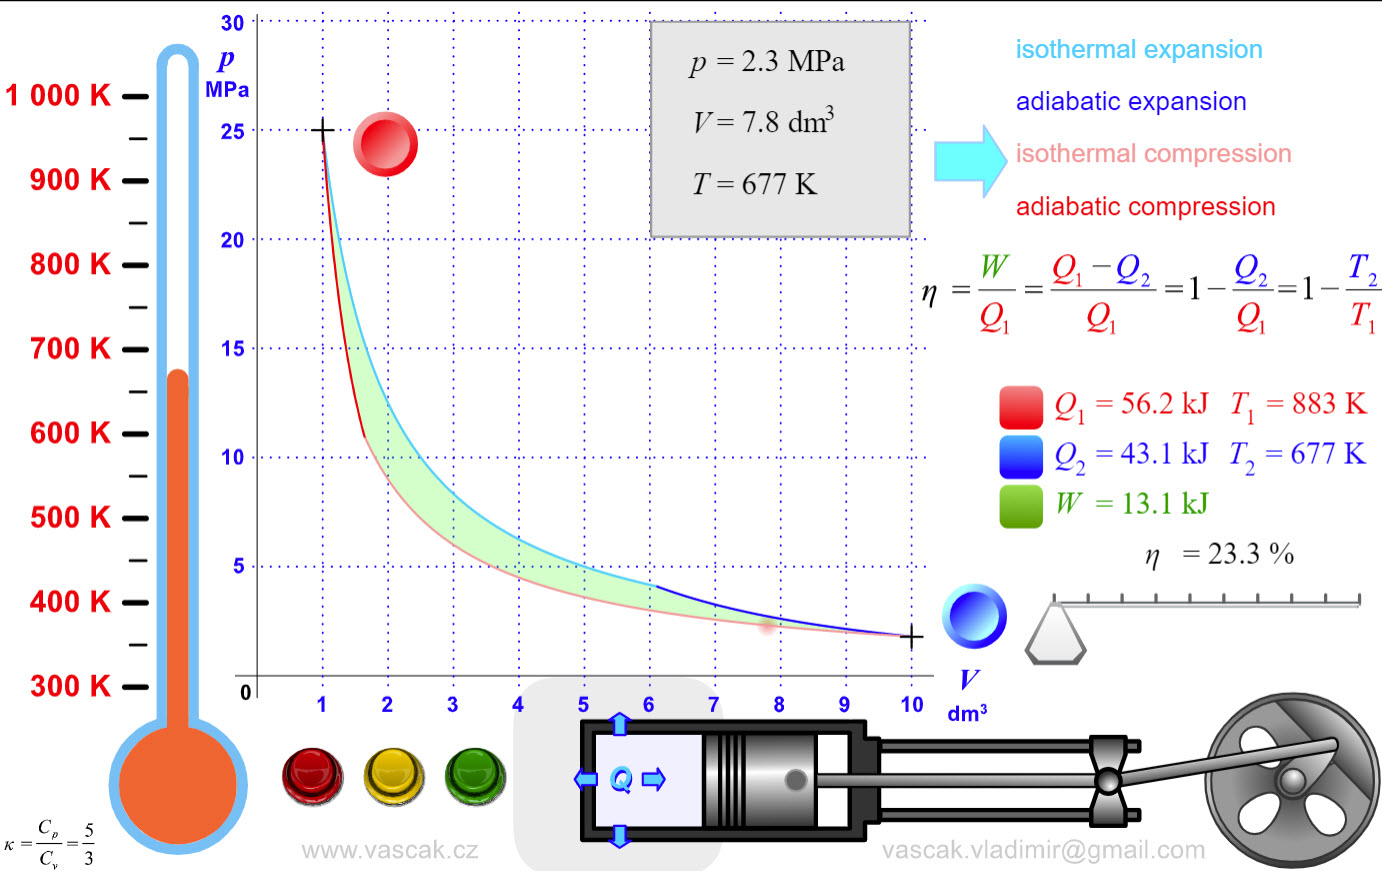 |
Another nice animation showing the Carnot Cycle. |
| Two-Stroke Engine | 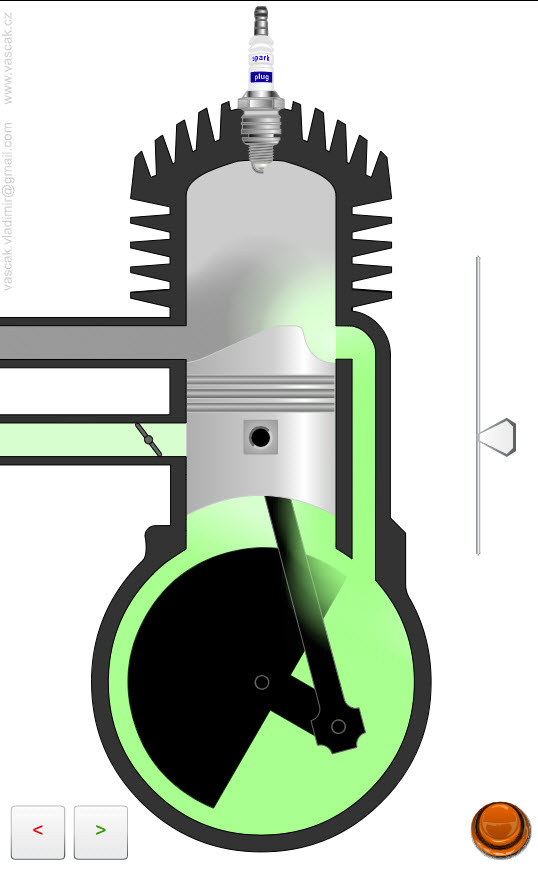 |
Animation showing the operation of a two-stroke engine. |
| Four-Stroke Engine | 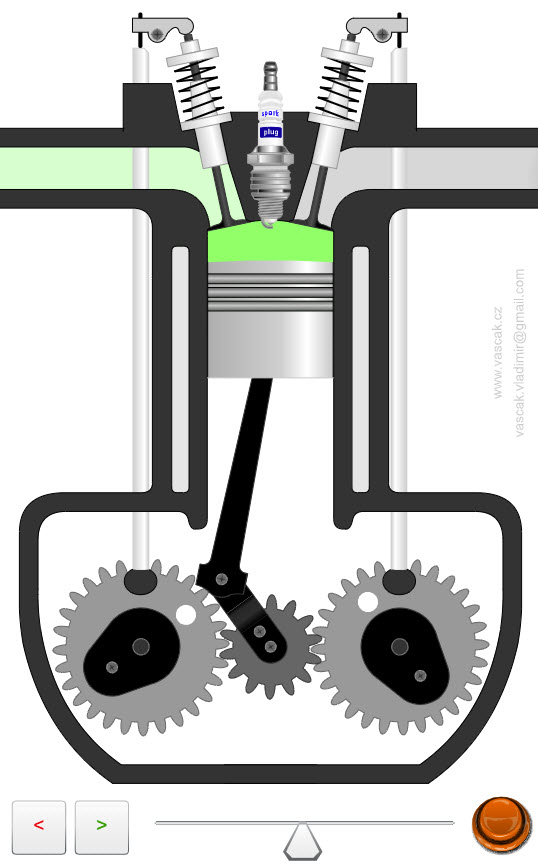 |
Animation showing the operation of a four-stroke engine. |
| Diesel Engine | 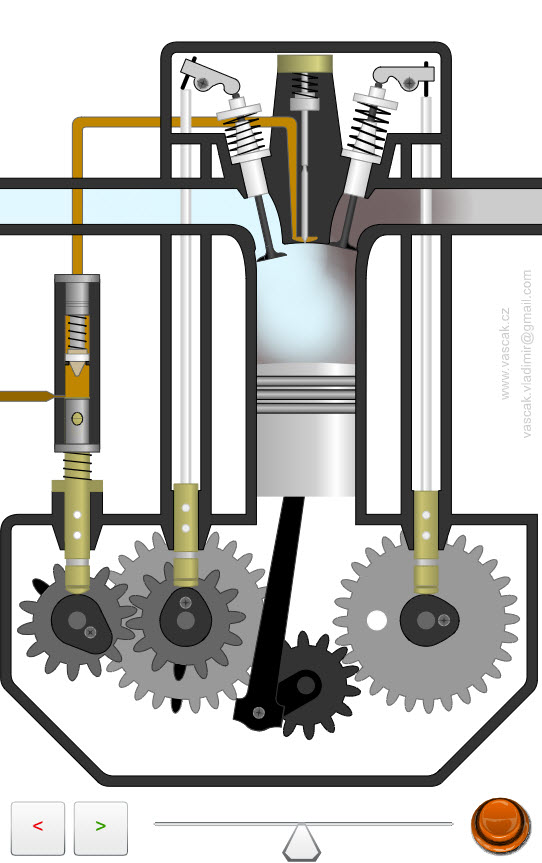 |
Animation showing the operation of a diesel engine. |
| Refrigerator | 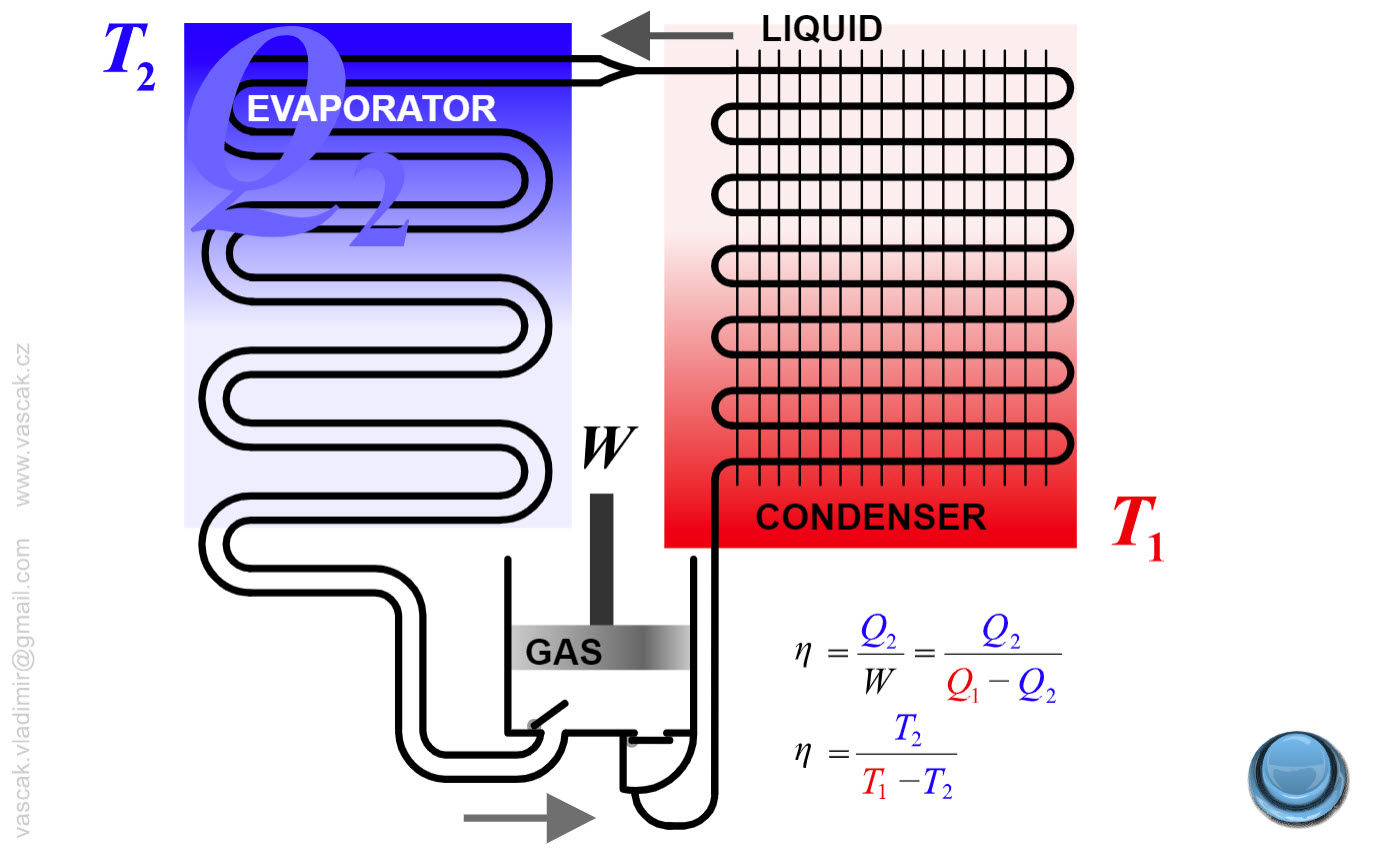 |
Animation showing the operation of a refrigerator. |
| Heat Engine | 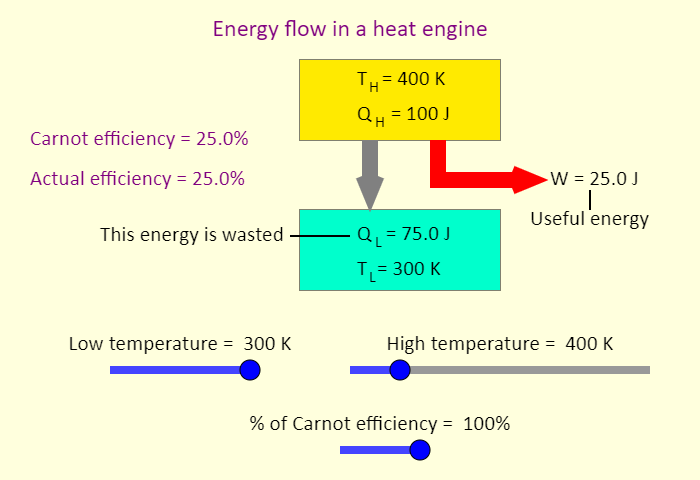 |
Animation showing the operation of a heat engine. |
| Air Conditioner | 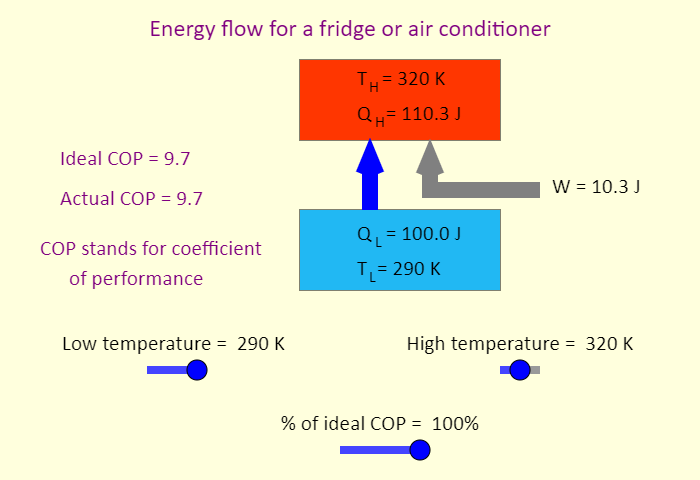 |
Animation showing the operation of an air conditioner. |