

Student Learning Objectives
Lessons / Lecture Notes
Important Equations
Example Problems
Applets and Animations
Student Learning Objectives
Lessons / Lecture Notes
PY105 Notes from Boston University (algebra-based):
Physics 2B notes from Dr. Bobby W.S. Lau (algebra-based)
HyperPhysics (calculus-based)
Physics 4C notes from Dr. Bobby W.S. Lau (calculus-based)
Important Equations (for algebra-based Physics)
|
|
|
Example Problems
Example Problems for algebra-based physics (from College Physics 2nd Edition by Knight, Jones, and Field):
Example Problems (Using Energy and Thermal Properties)
Solutions to Example Problems (Using Energy and Thermal Properties)
Example Problems for calculus-based physics (from Fundamentals of Physics 9th Edition by Halliday, Resnick, and Walker):
Example Problems (Temperature, Heat, and First Law) | Example Problems (Kinetic Theory) | Example Problems (Entropy and Second Law of Thermo)
Solutions to Example Problems (Temperature, Heat, and First Law) | Solutions to Example Problems (Kinetic Theory) | Solutions to Example Problems (Entropy)
| Temperature Scales |
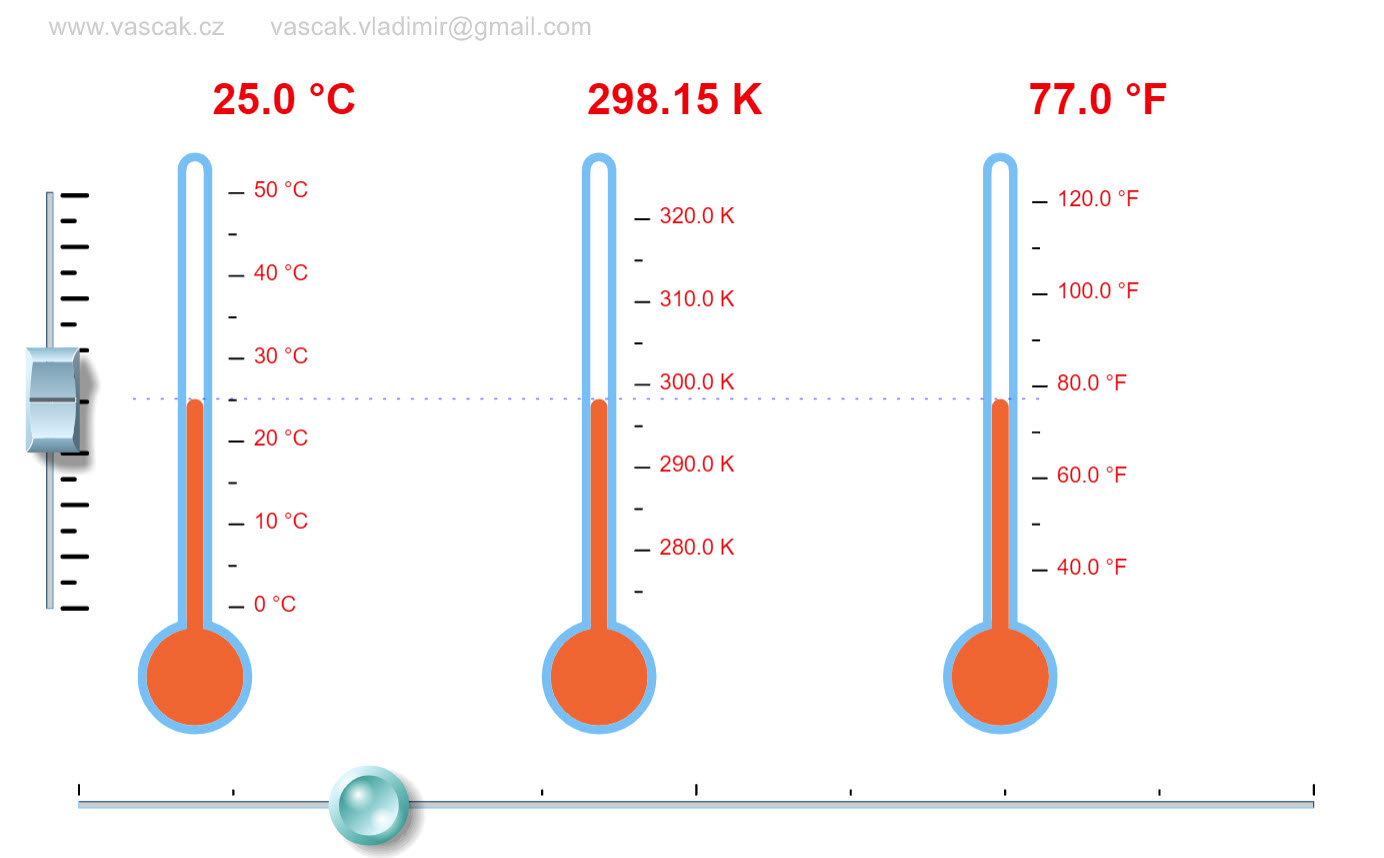 |
This simple animations shows how the different temperature scales are related. |
| Thermometer | 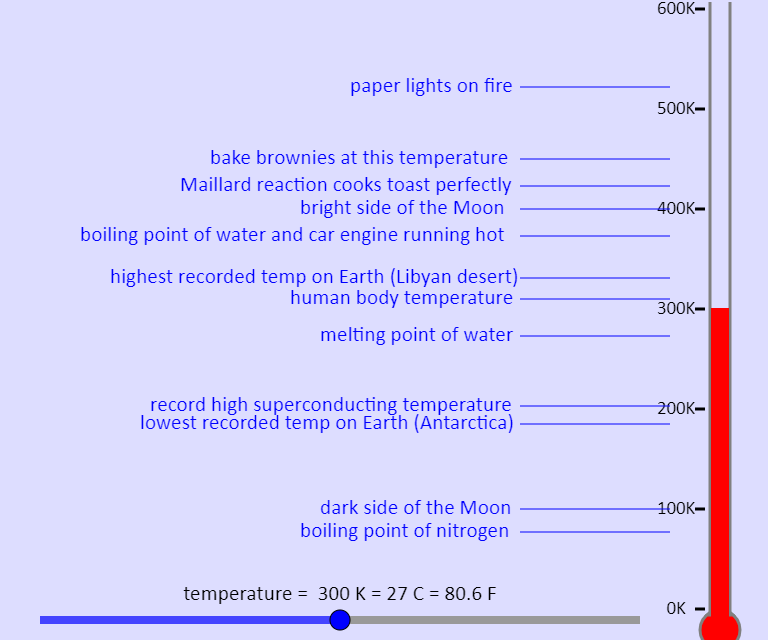 |
This simulation shows a thermometer. You can use the slider to change the temperature, which you can see in Kelvin, Celsius, and Fahrenheit. Here we have absolute zero at -273 degrees Celsius, which is just slightly off, but no big deal. You can also see the temperatures of various different things, so you can see those relative to one another. |
| Gases Intro | 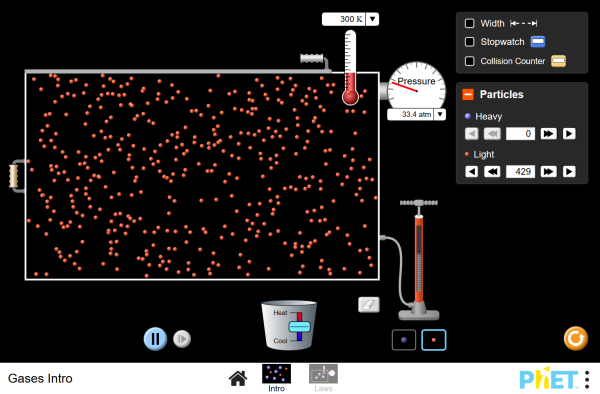 |
Pump gas molecules to a box and see what happens as you change the volume, add or remove heat, and more. Measure the temperature and pressure, and discover how the properties of the gas vary in relation to each other. |
| Gas Properties | 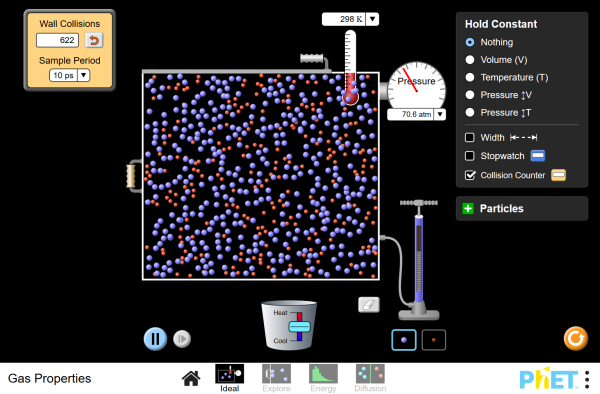 |
Pump gas molecules to a box and see what happens as you change the volume, add or remove heat, and more. Measure the temperature and pressure, and discover how the properties of the gas vary in relation to each other. Examine kinetic energy and speed histograms for light and heavy particles. Explore diffusion and determine how concentration, temperature, mass, and radius affect the rate of diffusion. |
| Ideal Gas |
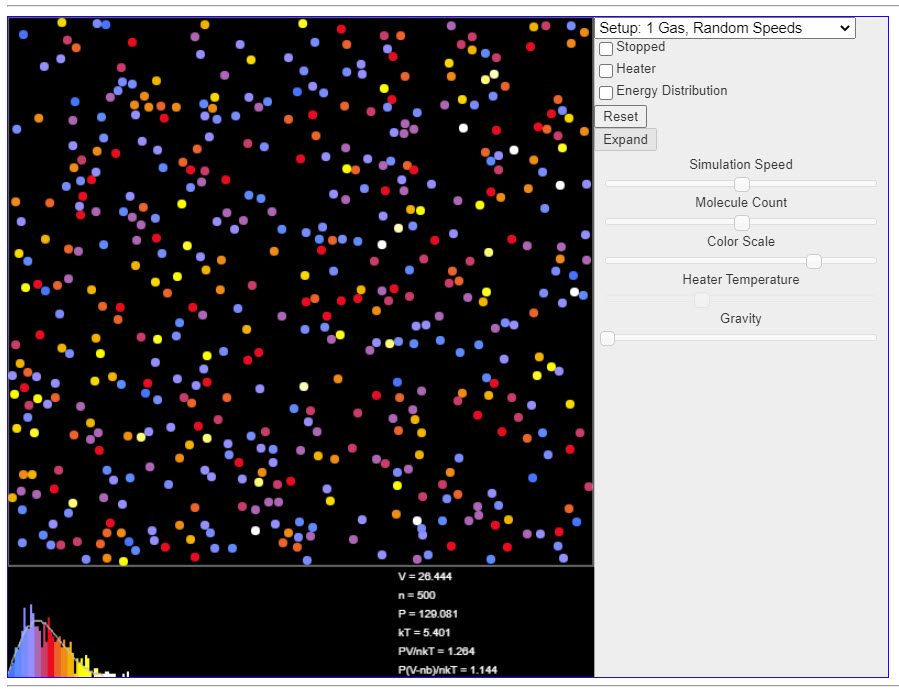 |
This java applet is a simulation that demonstrates the kinetic theory of gases. The color of each molecule indicates the amount of kinetic energy it has. Use the Setup popup menu at the upper right to select one of several examples. At the bottom of the applet is a velocity histogram showing the distribution of velocities of the molecules. Again, color is used to indicate kinetic energy. |
| An Ideal Gas | 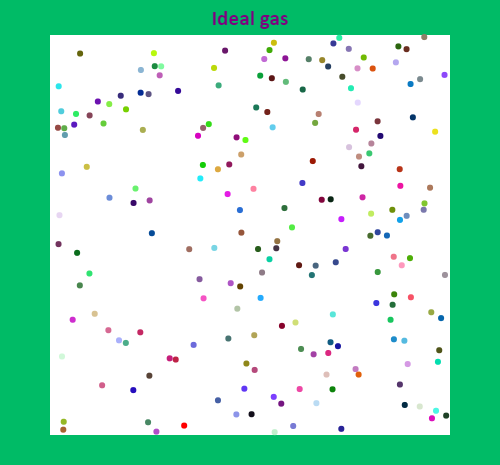 |
An ideal gas simulation, which is not always ideal. |
| States of Matter: Basics | 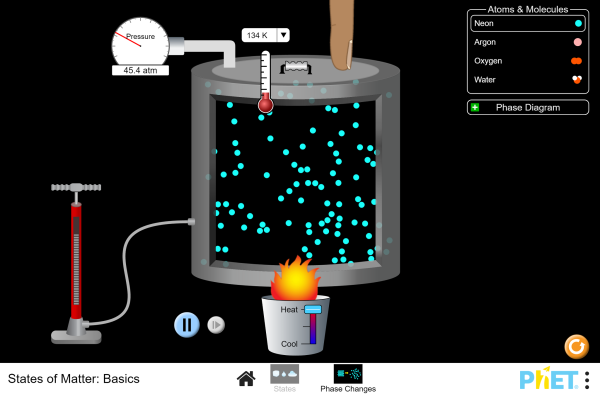 |
Heat, cool and compress atoms and molecules and watch as they change between solid, liquid and gas phases. |
| States of Matter | 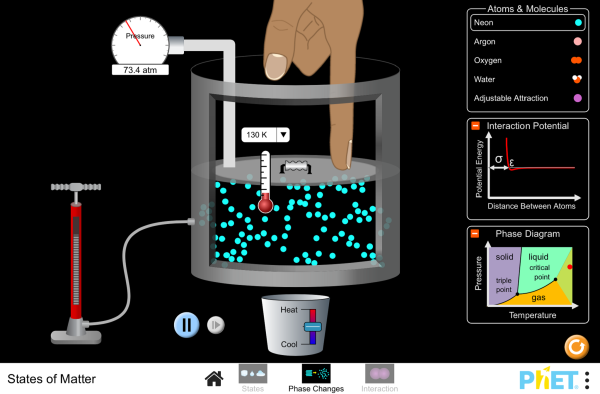 |
Watch different types of molecules form a solid, liquid, or gas. Add or remove heat and watch the phase change. Change the temperature or volume of a container and see a pressure-temperature diagram respond in real time. Relate the interaction potential to the forces between molecules. |
| One Atom Gas | 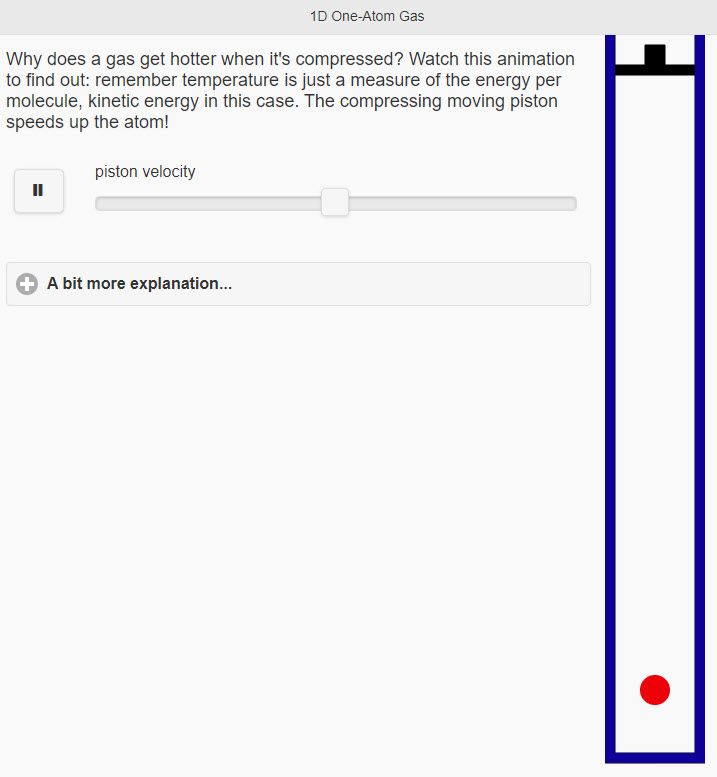 |
Why does a gas get hotter when it's compressed? Watch this animation to find out: remember temperature is just a measure of the energy per molecule, kinetic energy in this case. The compressing moving piston speeds up the atom! |
| Molecular Motion | 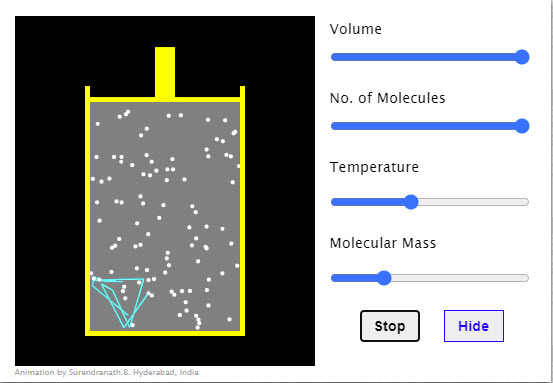 |
The molecules shown undergo elastic collisions amongst themselves and with the vessel walls. Observe the path of a molecule when the molecular size is set to minimum. Show/Hide button shows or hides the path followed by a molecule between collisions. |
| Speed Distribution of an Ideal Gas | 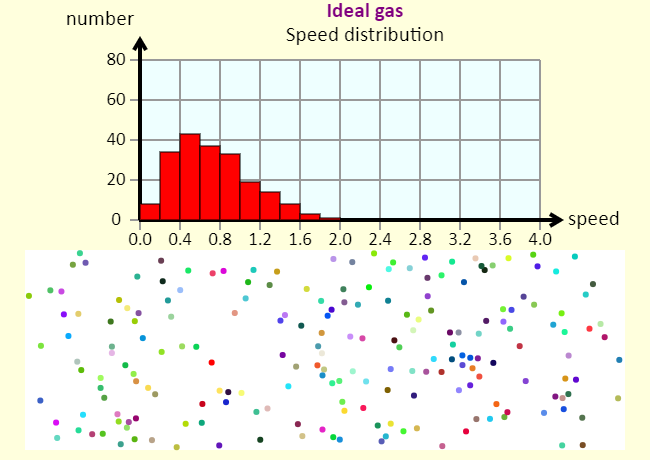 |
The histogram shows the distribution of speeds in the gas. The speeds are in arbitrary units. |
| Maxwell Distribution | 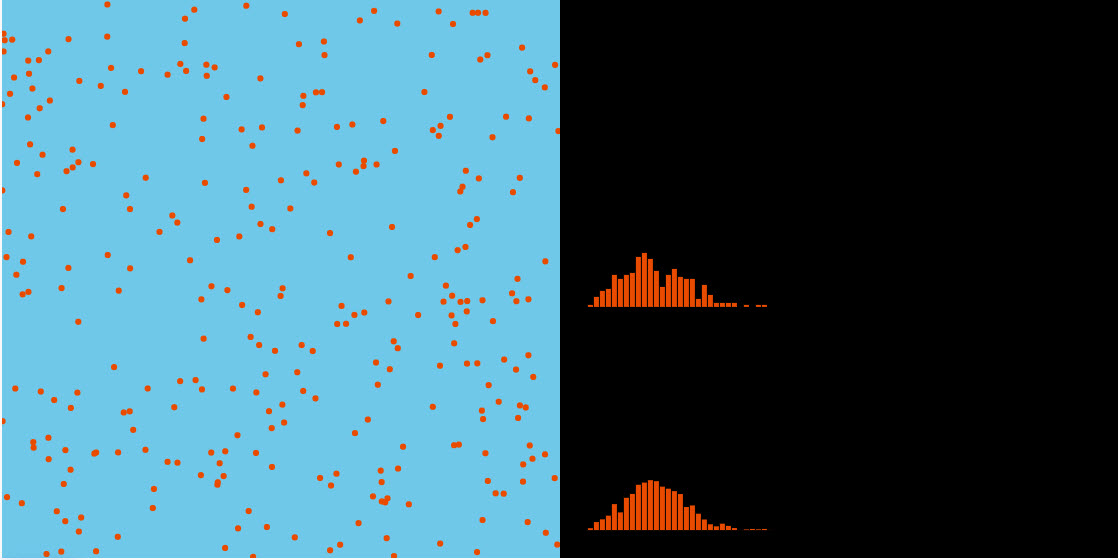 |
This applet shows the distribution of molecular speeds as well as the theoretical distribution. |
| Velocity Distribution of Ideal Gas Molecules | 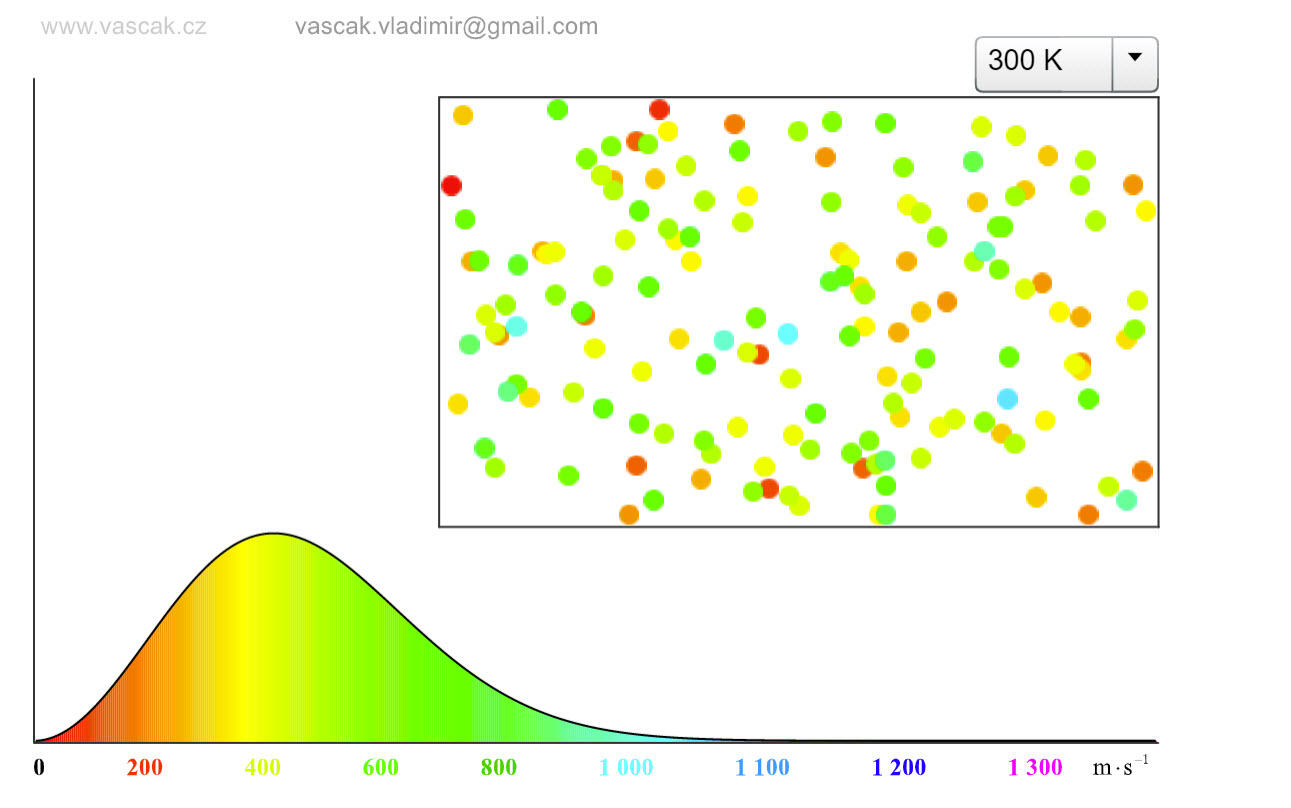 |
This nice applet shows the velocity distributions of ideal gas molecules at differenty temperatures. |
| Temperature vs. Time | 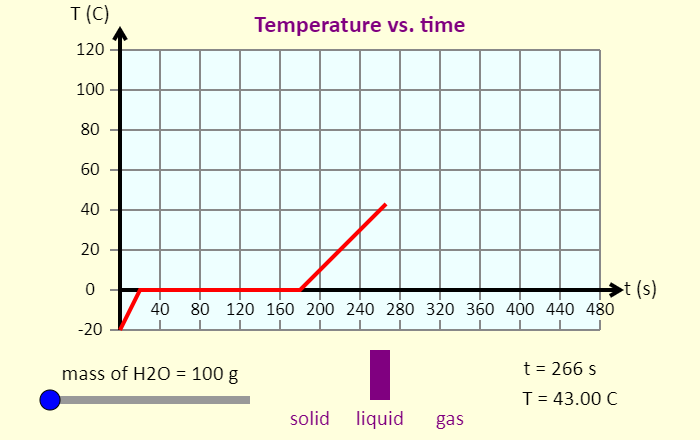 |
This simulation shows the graph of temperature as a function of time for a sample of water that starts at -20 degrees C, and has heat added to it at a constant rate. The simulation uses constants in units of calories, because those are nice numbers for water. The specific heat of liquid water is 1 cal / (g deg. C), while the specific heat of solid or gaseous water is 0.5 cal / (g deg. C). The latent heat of fusion of water is 80 cal / g, and the latent heat of vaporization of water is 540 cal / g. With these numbers and the information from the graph, you should be able to figure out the rate at which energy is added to the water sample. Don't forget to be amazed by how much time the sample spends changing phase. |
| Internal Energy | 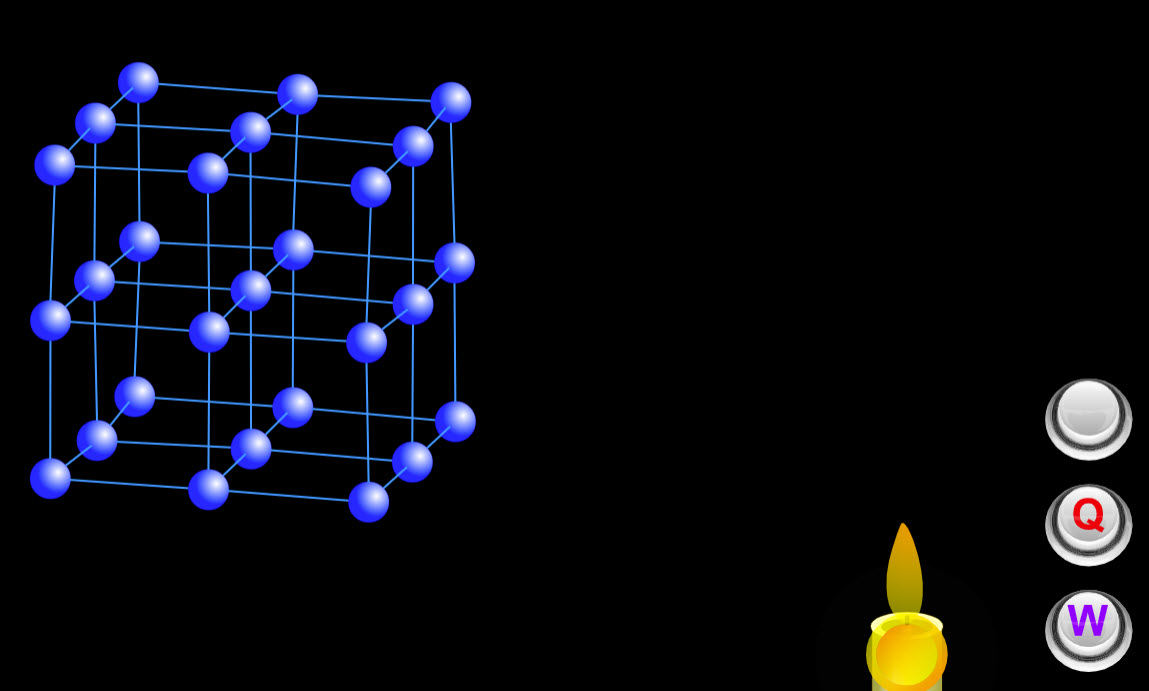 |
This cool animation shows how the internal energy changes when heat is added or work is done on the system. |
| Diffusion | 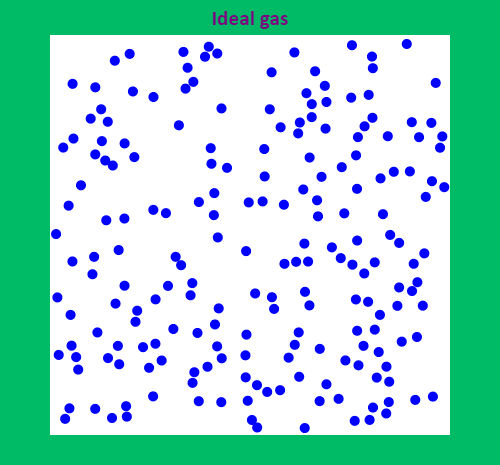 |
This simulation shows the process of diffusion. You start with a container of 200 ideal gas molecules, in blue. Set the temperature with the slider. Then, add 50 additional molecules, which are red. How long does it take for them to diffuse? In other words, how long does it take for them to spread evenly throughout the box? Does this time have anything to do with temperature? |
| Diffusion | 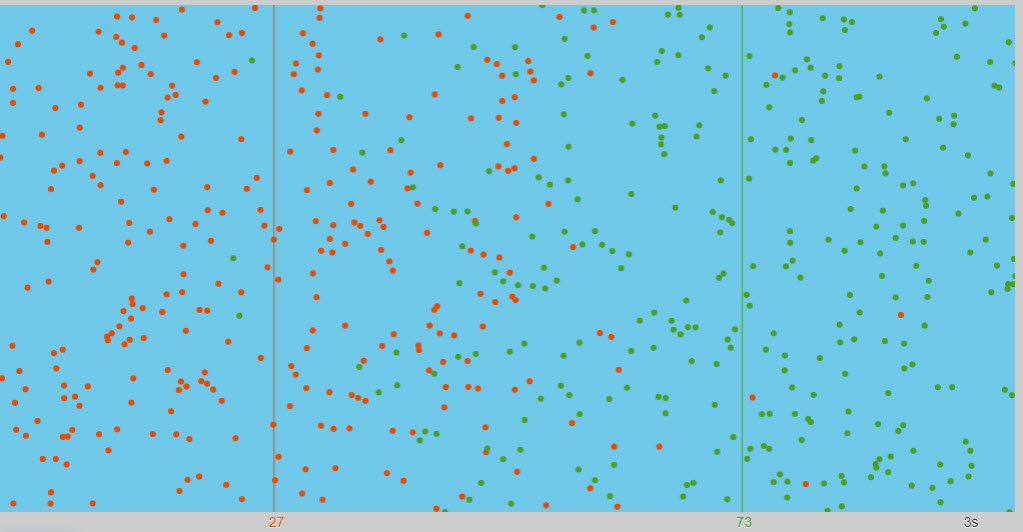 |
Nice animation showing the diffusion of two different types of particles. The red and green particles start on equal halves The red and green lines show the center of mass of each set |
| Brownian Motion |  |
This is a simulation of Brownian motion (named for Robert Brown, but explained in some detail by Albert Einstein). Brownian motion is the apparently random motion of something like a dust particle in the air, driven by collisions with air molecules. The simulation allows you to show or hide the molecules, and it tracks the path of the particle. See if you think there is any dependence on temperature - you can control the temperature with the slider. |