Student Learning Objectives
Lessons / Lecture Notes
Important Equations
Example Problems
Applets and Animations
Student Learning Objectives
Lessons / Lecture Notes
PY106 Notes from Boston University (algebra-based):
Physics 2C notes from Dr. Bobby W.S. Lau (algebra-based)
HyperPhysics (calculus-based)
Important Equations (for algebra-based Physics)
Example Problems
Example Problems for algebra-based physics (from College Physics 2nd Edition by Knight, Jones, and Field):
Example Problems (Quantum Physics and Atoms)
Solutions to Example Problems (Quantum Physics and Atoms)
Example Problems for calculus-based physics (from Fundamentals of Physics 9th Edition by Halliday, Resnick, and Walker):
Example Problems (Photons and Matter Waves)
Solutions to Example Problems (Photons and Matter Waves)
Applets and Animations
| Brownian Motion |  |
On the right, the jiggly path of a tiny particle observed through a microscope. On the left, Einstein's explanation: buffeting by (much tinier) molecules. Please adjust the number of small particles according to your screen size. |
| Brownian Motion | 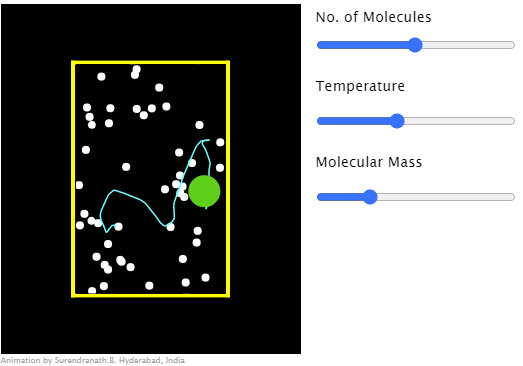 |
Collision between a dust particle (green) and gas molecules (white). |
| Brownian Motion |
Nice animation showing Brownian Motion. |
|
| Blackbody Spectrum | 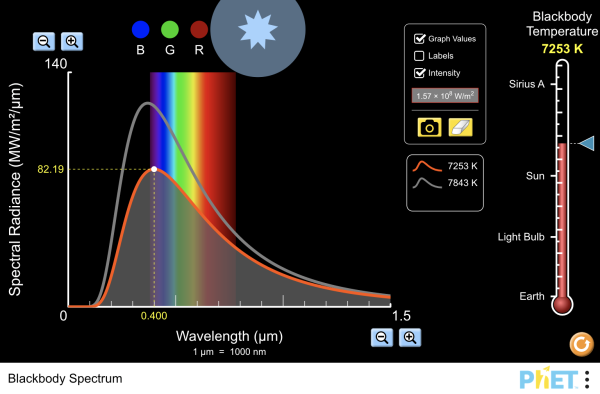 |
How does the blackbody spectrum of the sun compare to visible light? Learn about the blackbody spectrum of Sirius A, the sun, a light bulb, and the earth. Adjust the temperature to see the wavelength and intensity of the spectrum change. View the color of the peak of the spectral curve. |
| Blackbody Radiation | 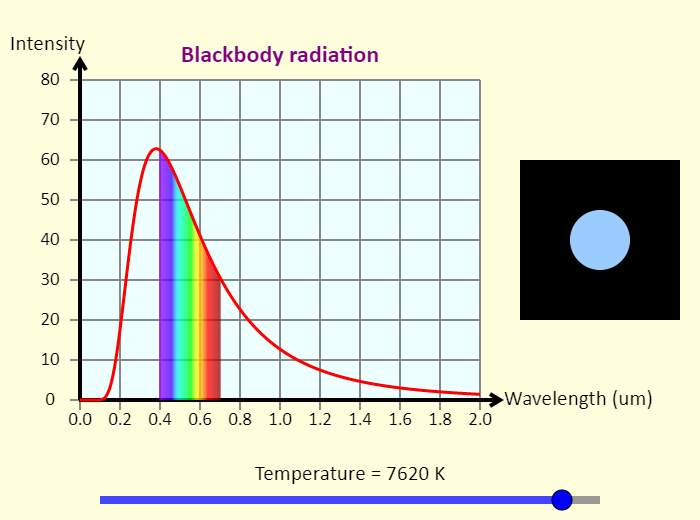 |
This simulation shows the spectrum of light emitted by a blackbody as a function of wavelength. Adjust the temperature to see how changing the temperature changes the amount of light emitted by the blackbody, as well as the peak wavelength of the light. The wavelength is measured in micrometers, and the intensity is given in arbitrary units. To the right of the graph, in the middle of the black region, is a circle showing the approximate color of a blackbody at that temperature. Such a blackbody could be an object here on Earth that is so hot it is glowing, or even a star in the sky. You can tell what the surface temperature of a star is just by looking at its color. |
| Blackbody Radiation | 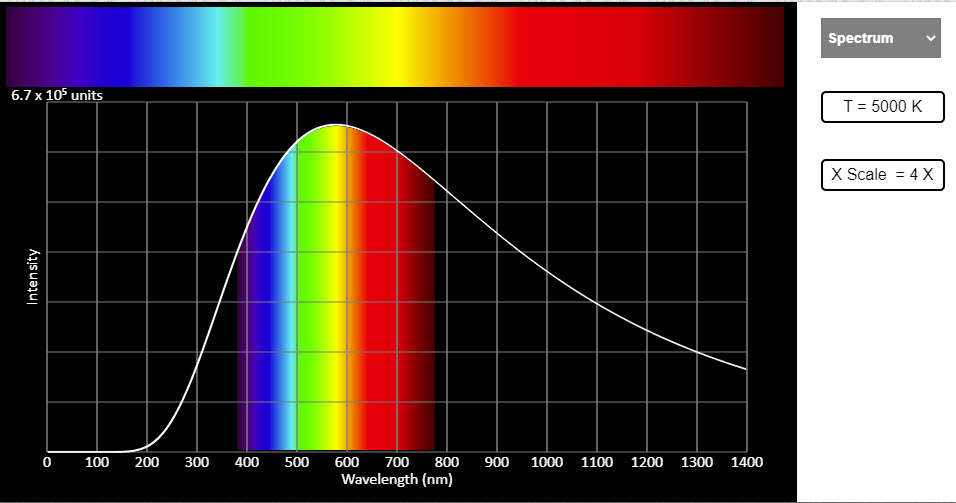 |
All objects above absolute zero radiate heat. The radiation is due to the random motion of charged particles in them. Greater the temperature, greater the random motion and greater the amount of radiation emitted. And this energy radiated has various wavelengths in it. The spread of energy amongst various wavelengths and the appearance of a black body at different temperatures are shown in the visual. The black body we are talking about is just an idealized hot body. As the temperature of the body emitting radiation increases the brighter part of the spectrum shifts towards shorter wave lengths. This can be observed in the spectrum choice - you need to change the temperature by adjusting the slider. This also is seen as the dominant wavelength in the graphs choice. Five graphs are shown for five different values of temperature. The peaks can be seen to shift towards the lower wavelength side for higher temperatures. Also the peaks for higher temperatures are higher indicating the increase in the total energy radiated. The overall appearance of the hot body, that is, the color of the body as it appears to the eye is shown in the color and temperature choice. |
| Blackbody Radiation | 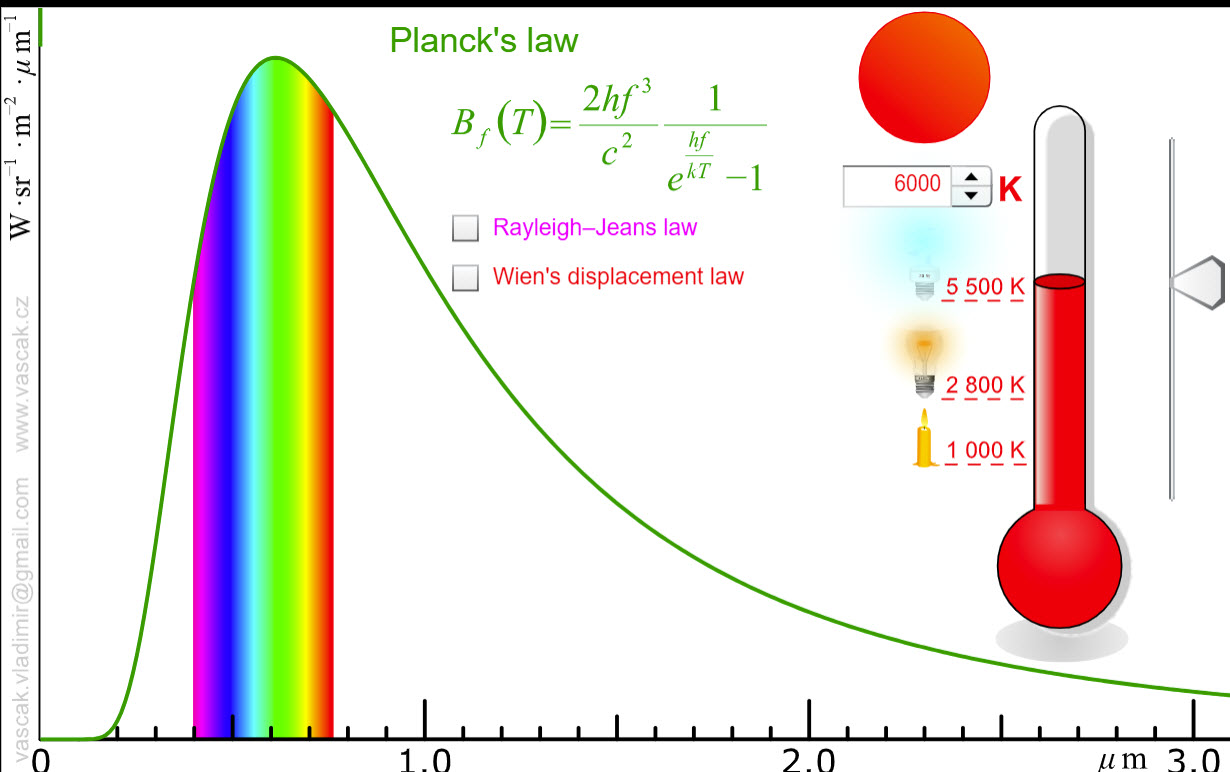 |
This applet shows blackbody radiation as well as the predictions of Rayleigh-Jeans law and Wien's displacement law. |
| Blackbody Model | 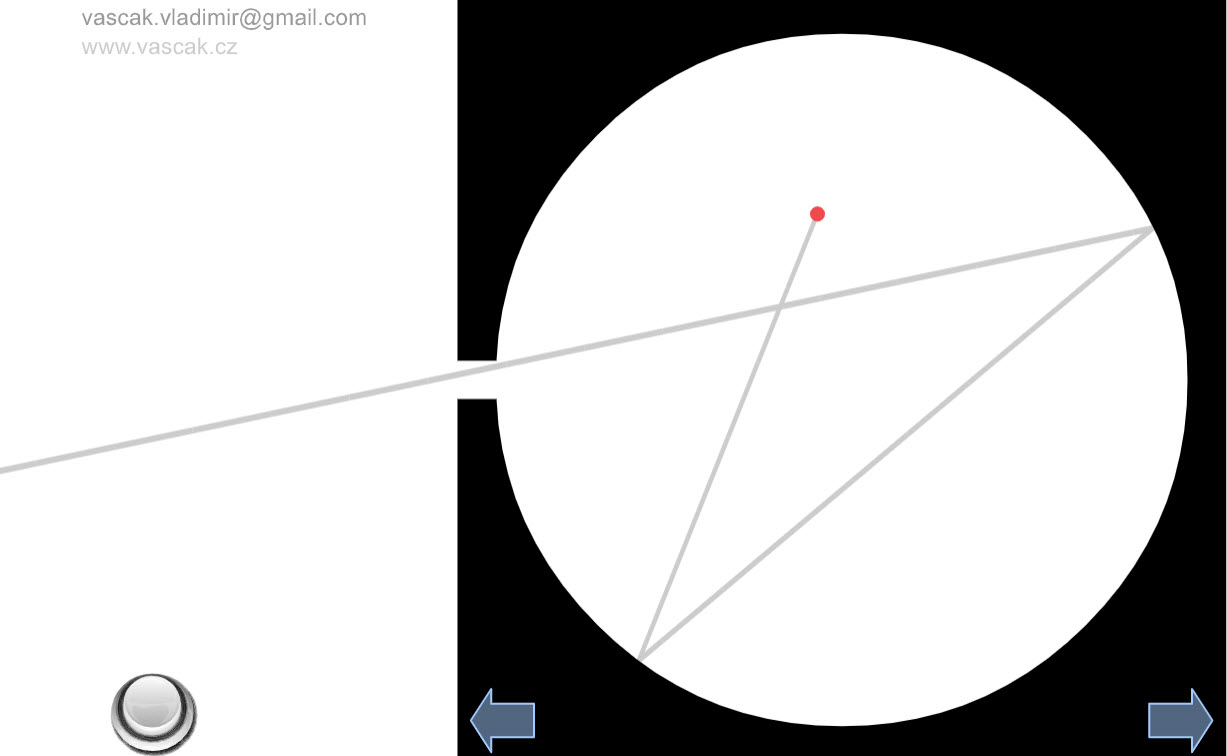 |
A nice animation showing a model of blackbody radiation. |
| Rutherford Scattering | 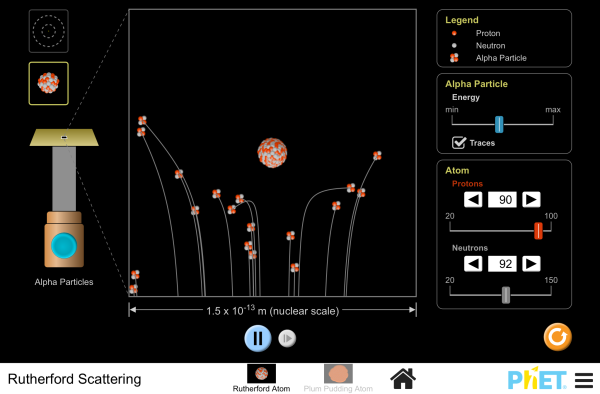 |
How did Rutherford figure out the structure of the atom without being able to see it? Simulate the famous experiment in which he disproved the Plum Pudding model of the atom by observing alpha particles bouncing off atoms and determining that they must have a small core. |
| Rutherford Gold Foil Experiment | 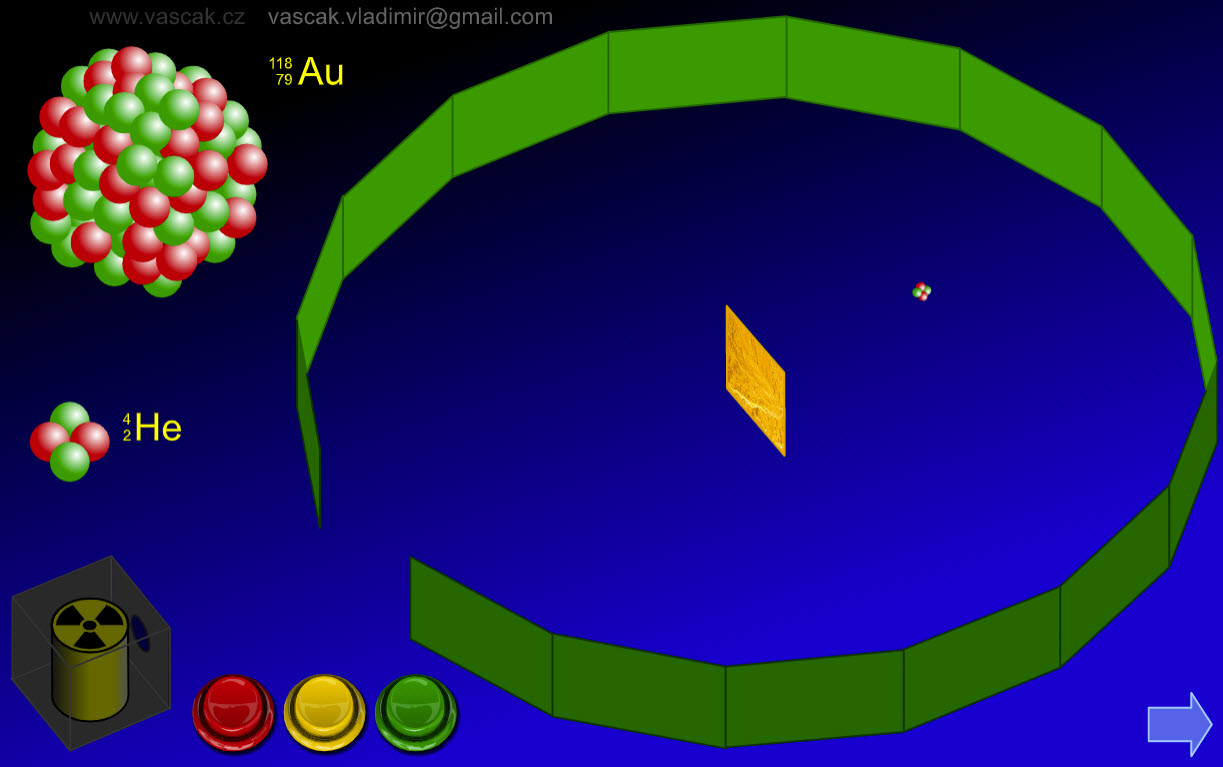 |
A nice animation showing Rutherford's gold foil experiment. |
| Rutherford Scattering | 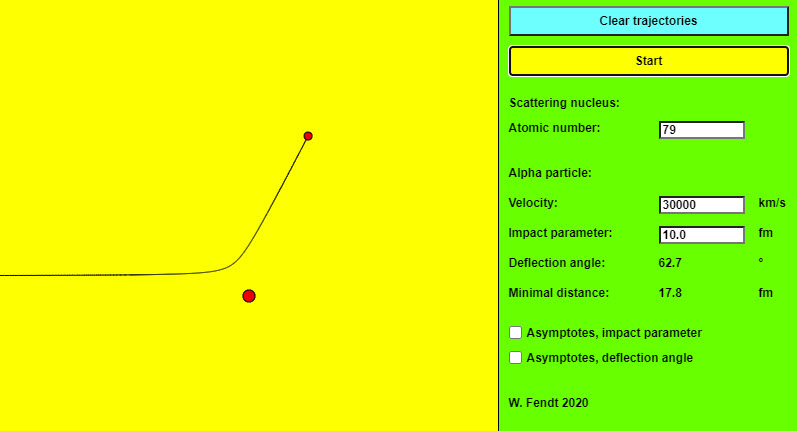 |
The New Zealand-born physicist Ernest Rutherford carried out a famous experiment on the structure of the atom in 1911. He bombarded a thin gold foil with alpha rays (helium-4 nuclei of high velocity, as they occur in many radioactive materials) and analysed the distribution of the deflection angles (scattering angles). This angle describes the changed motion direction of an alpha particle passing an atomic nucleus of the foil. This app simulates the motion of an alpha particle under the influence of the repulsive electrostatic force (Coulomb force) exerted by a single atomic nucleus of the gold foil. The trajectory of the particle is (approximately) a hyperbola, with the target nucleus as one of the focal points of this hyperbola. The control panel on the right side has two buttons, one to clear the particle trajectories, and one to "start" the motion of a single alpha particle. For the scattering nucleus, the atomic number (number of protons) can be entered. For the alpha particle, you can vary the velocity and the impact parameter (distance between the scattering nucleus and the asymptotes of the hyperbola). Inputs outside the permitted range are automatically changed. Below the input fields, you can read the values of the deflection angle and the minimal distance. The femtometer unit (fm) is used for this purpose: 1 fm = 10−15 m. Two option fields are used to specify whether asymptotes, impact parameter, and deflection angle should be displayed apart from the particles and orbits involved. |
| Rutherford Scattering |  |
Rutherford discovered the nucleus by scattering alpha particles from a gold atom, expecting to find only small angle scattering based on his belief in Thomson's plum pudding model. He was amazed to find occasional very large scattering angles, only explicable by assuming a very compact heavy central charged object: a nucleus. For smaller nuclei, he found the alphas actually bounced off the nuclear surface, giving a different scattering pattern, and making it possible to estimate nuclear size. The nuclear radius turned out to be a fraction of a ten-thousandth of the atomic radius. |
| Predicted Rutherford Scattering for a Thomson Atom | 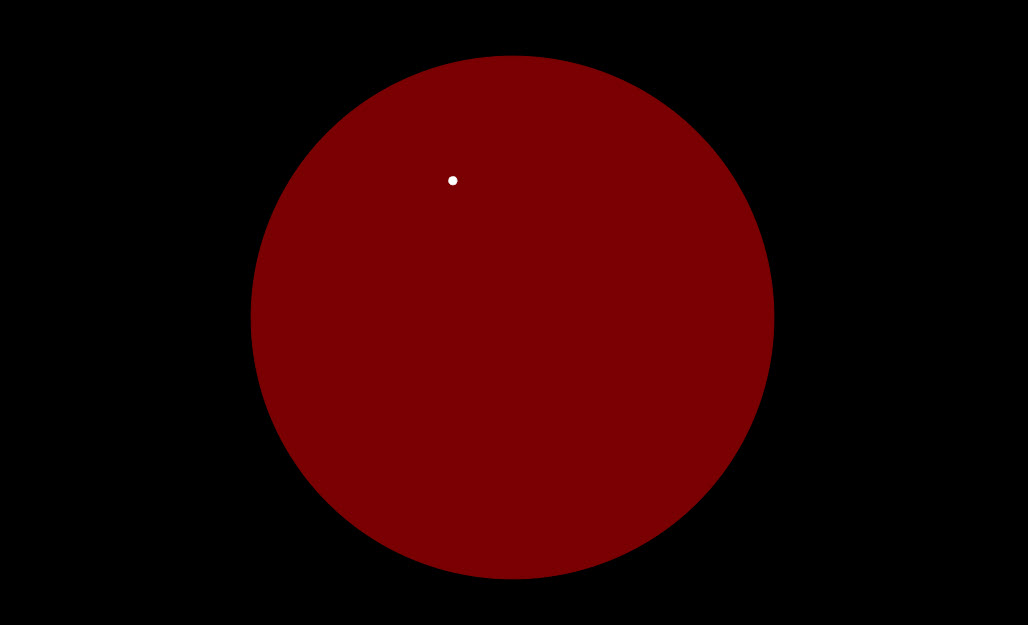 |
J. J. Thomson was the first to measure the charge/mass ratio, e/m, for the electron, and found it to be thousands of times greater than that for ions. He guessed the charge was the same as the unit for negative ions, so the electron mass must be really small. He knew that the atom contained electrons, but was electrically neutral overall, so he suggested the "plum pudding" model: an atom was a spherical object the mass and positive charge distributed throughout somehow, the electrons sitting inside the sphere, they could move around if hit, but were kept close by the electrostatic attraction. A fast (heavy and positively charged) alpha particle would scatter the electrons like chaff, but would itself be somewhat deflected by the heavy positive sphere. The deflection could be calculated, since the speed and mass of the alphas, and the size of the atom, were known. The calculations suggested a small fraction of a degree. (The animation above greatly exaggerates this deflection -- the point here is to illustrate how much more dramatic the deflections are if the charge and mass are concentrated in a nucleus). In the experiment, the alphas went through a thin sheet of gold, so might encounter at most 400 or so atoms, and might be deflected as much as two degrees (at most) if these were Thomson atoms. |
| Models of the Atom | 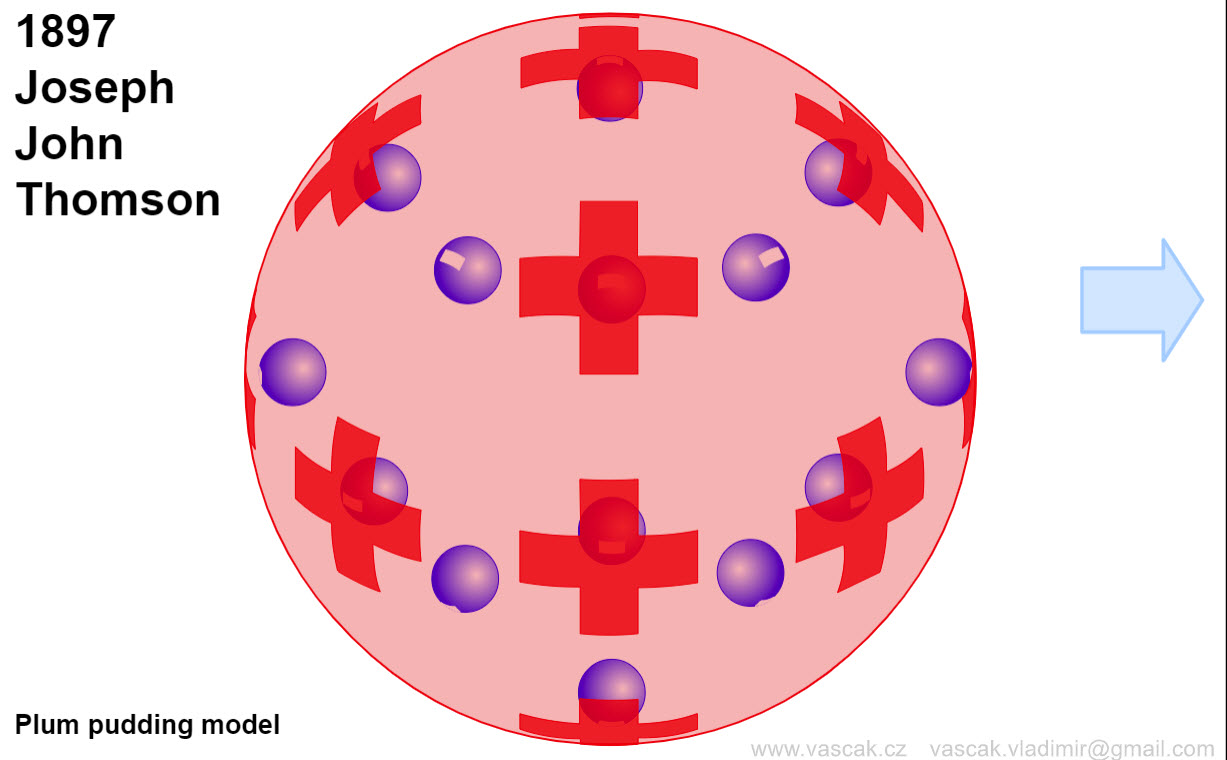 |
An excellent animation showing the different atomic models. |
| Photoelectric Effect | 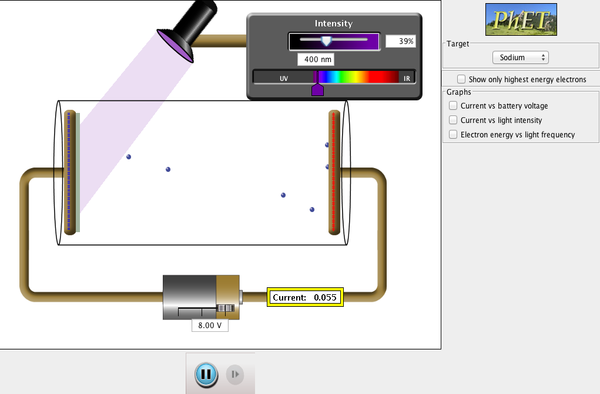 |
See how light knocks electrons off a metal target, and recreate the experiment that spawned the field of quantum mechanics. |
| The Photoelectric Effect | 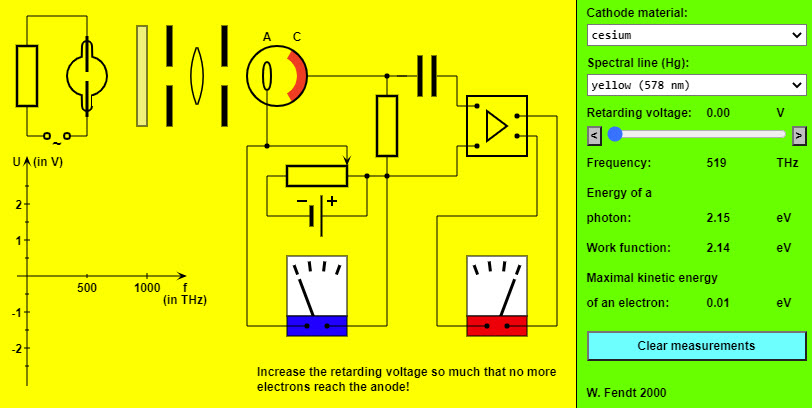 |
This HTML5 app simulates an experiment for the determination of the Planck constant and the work function: A single spectral line is filtered out from the light of a mercury lamp. This light strikes the cathode (C) of a photoelectric cell and causes the emission of electrons (or not). In order to find the maximal kinetic energy of the ejected electrons it is necessary to enlarge a retarding voltage by means of a potentiometer connection so much that no more electrons arrive at the anode (A). The blue coloured meter indicates the size of this retarding voltage. You can see from the red coloured meter whether electrons reach the anode. The panel at the right side allows you to vary the cathode's material, the wavelength and the retarding voltage. The indicated values refer to the frequency of the light and to the energy balance of the photoelectric effect. The results of the measurements are drawn in a frequency voltage diagram on the bottom left, but can be cleared with the button of the panel. The evaluation of the two measurement series by means of the diagram will result in two parallel lines. From the slope of these lines the Planck constant (h) can be calculated. In addition, you can read the work function of the respective cathode material (in eV, i.e. electron volt) directly from the intersection with the vertical axis. |
| Photoelectric Effect | 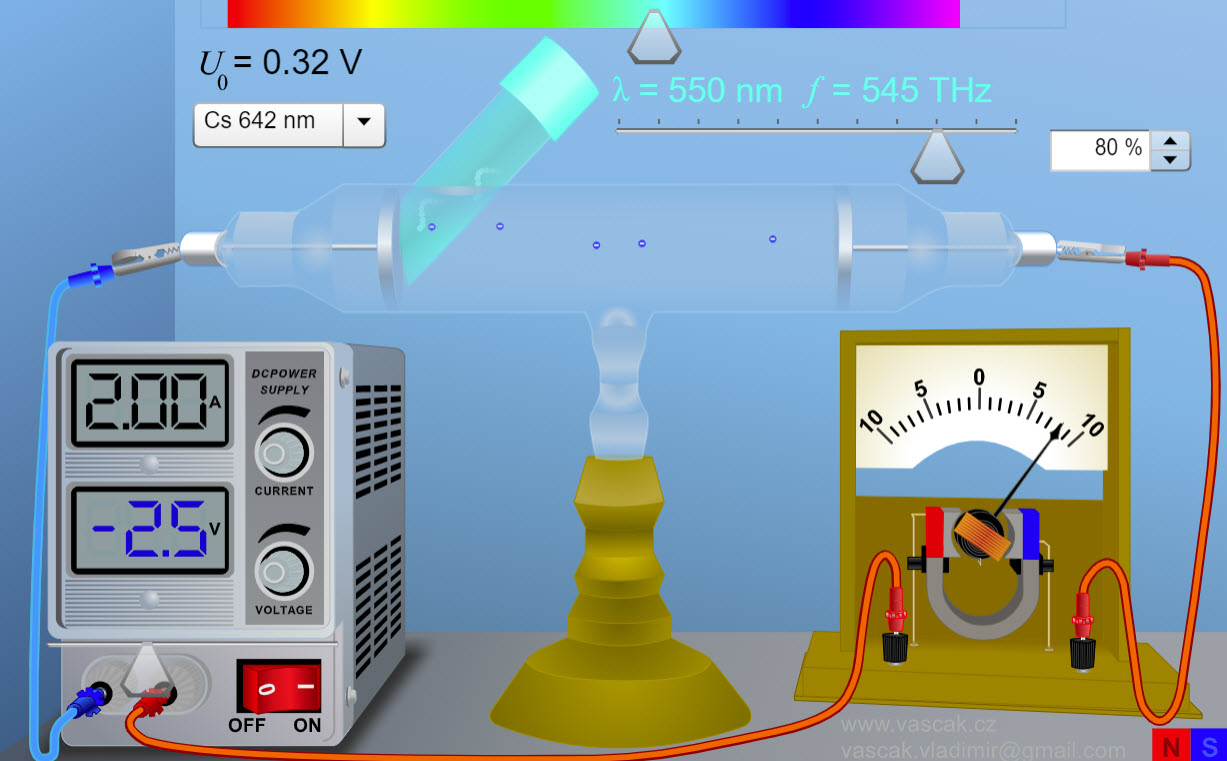 |
Animation showing the photoelectric effect. There are no directions so this animation is a bit challenging to use. |
| Compton Scattering | 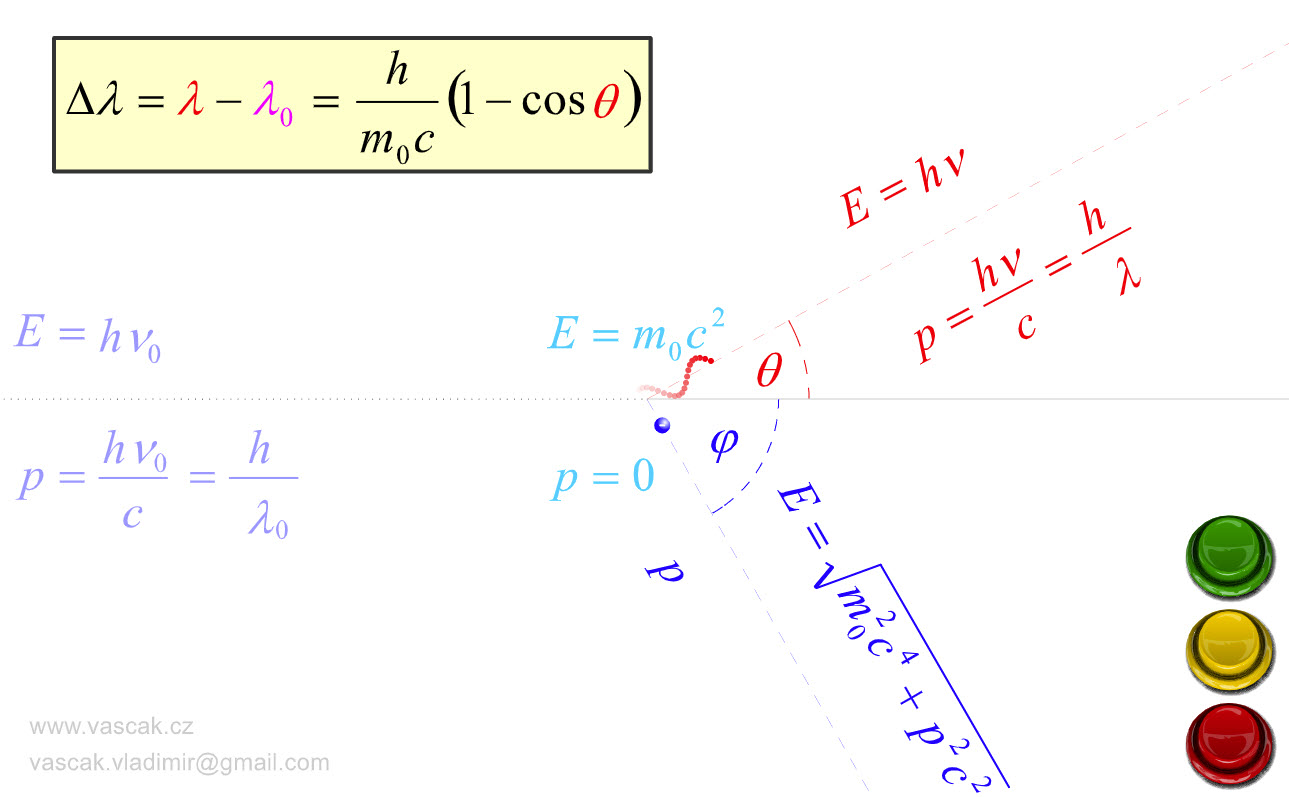 |
Nice animation showing Compton Scattering. |